incplot; Three Old Workhorses; Linux Commands Cheat Sheet
(The OG expansion of “KISS” may be amusing, but we’ve got enough negative language floating around these days.)
Today’s Drop is short and sweet, but I’m pretty sure most folks will 100% enjoy the first section, and a decent chunk of folks will learn at least one new utility from the last two.
TL;DR
(This is an LLM/GPT-generated summary of today’s Drop using SmolLM3-3B-8bit via MLX and a custom prompt.)
It failed to put the <> wrappers around the links. I only keep pointing this out since I have this model configured pretty tightly and do not mix up the prompts. The lack of consistency in this minute task likely means this model is not really fit for practical use when repeatable precision is required.
incplotis a terminal plotting tool that reads structured data from stdin and renders bar, line, and scatter plots using Unicode characters. It allows column selection, filtering, and resizing, with an example using theirisdataset from R. (https://github.com/InCom-0/incplot)nlnumbers lines in input,jotgenerates numbered tickets, andprmerges columns side-by-side. An example mergesjotoutput with a CSV file to create a numbered index. (https://github.com/InCom-0/incplot)- A clean, multilingual guide to 491 Linux commands is available at https://linux-commands.labex.io/, offering a minimalist approach to command reference.
incplot

incplot is a fast and clever terminal plotting tool. It reads structured data (CSV, TSV, JSON, JSON Lines, NDJSON) from standard input and draws charts directly in the terminal using Unicode characters.
It can render several chart types: bar charts (vertical, horizontal, stacked, or grouped), line plots, and scatter plots. If you don’t specify a chart type, it will try to choose one automatically based on the data.
You can control which columns are used for the main axis, for values, and for grouping categories. There’s also an option to filter out data points that are far from the mean, which helps keep extreme values from distorting the plot.
Plots can be resized by specifying width and height in character units so they fit the available terminal space.
The GitHub page has plenty of examples, but I felt compelled to show at least one here, since it did a fab job with R’s iris:
$ Rscript -e 'write.csv(iris, row.names=FALSE, quote=FALSE)' | incplot

Did I mention it’s super fast? Like, bonkers fast.
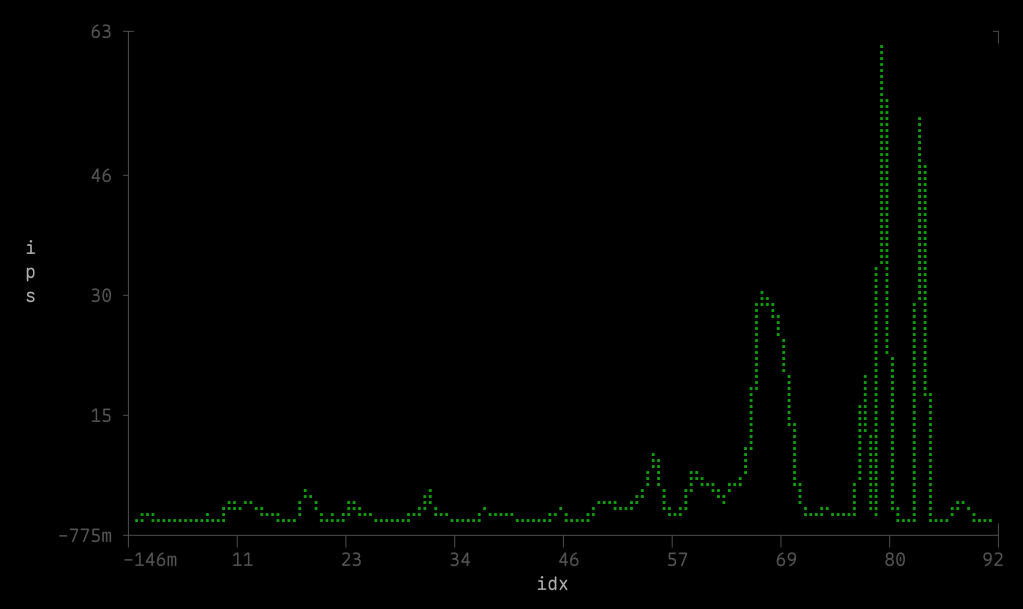
It didn’t like any of my YYYY-MM-DD columns when it came to asking for a line chart, so I ended up having to use one of the utilities in the next section to prefix the day column in the data file for this line chart of RCE attack activity against WebLogic (hence why there are no month/day labels):
macOS folks take note! 👉 I had to sudo /usr/bin/xattr -r -d com.apple.quarantine /opt/homebrew/bin/incplot to get it to work. I’m not sure if that’s due to extra protections on macOS 26 or not (since brew installed CLI utilities aren’t supposed to need the toxic bit removed).
Three Old Workhorses

Every Unix-like system has a handful of dusty utilities you rarely see mentioned in tutorials, but which quietly do useful things when coaxed into action. Three tried and true utilities I keep in active human RAM are nl, jot, and pr. They look like leftovers from the ’70s, but they’re still hiding in plain sight in nigh every modern shell.
nl is short for “number lines”. That’s literally what it does: it takes some input, and spits it back out with a counter stuck in front.
$ nl /etc/passwd | head -5
     1  root:x:0:0:root:/root:/bin/bash
     2  daemon:x:1:1:daemon:/usr/sbin:/usr/sbin/nologin
     3  bin:x:2:2:bin:/bin:/usr/sbin/nologin
     4  sys:x:3:3:sys:/dev:/usr/sbin/nologin
     5  sync:x:4:65534:sync:/bin:/bin/sync
It’s the command you reach for when you want a quick index without writing an awk one-liner. Unlike cat -n, nl actually tries to be smart about what counts as a “line” (code, comments, blank lines, etc.), though the defaults are usually fine.
jot is like an infinite roll of tickets. You tell it how many you want, where to start, and how to space them. It obliges without complaint.
$ jot 5
1
2
3
4
5
$ jot 5 10 50
10
20
30
40
50
This is super handy when you need a column of numbers for testing in a CLI workflow, or for pairing with other tools in a pipeline.
pr is an old-school “print” formatter, meant for laying out text for hard copy. A good tagline for it might be “Formatting Like It’s 1975”. Most folks never touch it anymore. But here’s the neat trick: pr can merge columns of text side-by-side. That means you can glue the output of jot next to the contents of a file, and 💥 you’ve got a numbered index.
Suppose you’ve got a CSV file with no ID column, and you want to add one. You could open it in R, but why not flex a little shell power?
# Generate row numbers with jot
jot -w "%d," $(wc -l < data.csv) 1 1 \
  | pr -m -t -s, - data.csv > indexed.csv
Breaking that down, we have:
wc -l < data.csvwhich counts how many rows are in the file.jot -w "%d," N 1 1which makes N numbers, starting at 1, each followed by a comma.pr -m -t -s, - data.csvwhich merges two inputs (thejotoutput and the CSV) into one file, separated by commas.
The result is your original CSV, but with a spiffy new index column at the front.
If your CSV has a header row, you can cheat by sticking a label in front:
(echo "id,$(head -1 data.csv)"; \
 jot -w "%d," $(( $(wc -l < data.csv) - 1 )) 1 1 \
   | pr -m -t -s, - <(tail -n +2 data.csv)) \
 > indexed.csv
If that seems like “work,” then just use nl (like I did for the incplot section), since it can handle the CSV indexing job with less ceremony, since it already knows how to prepend numbers to lines.
Here’s the basic form:
$ nl -w1 -s, data.csv > indexed.csv
Breaking that down:
-w1says “use a field width of 1” (so we don’t get padded spaces before the numbers).-s, sets the separator to a comma, so the new numbers drop right into place as the first CSV column.
Again, if your CSV has a header row, you’ll want to leave it alone and only number the data rows. That’s easy with a little split-and-reassemble trick:
{
  # print header with new column name
  echo "id,$(head -1 data.csv)"
  # number the rest
  tail -n +2 data.csv | nl -w1 -s,
} > indexed.csv
Linux Commands Cheat Sheet

This site is precisely what it says on the tin: “A clean and minimal guide to 491 Linux commands”.
No “load a JSON file of names and descriptions”.
No “load 3,000 JS files from CDN for full-text search”.
Just a clean, well-organized set of commands and descriptions in your choice of English, Simplified Chinese, Japanese, Korean, Russian, Spanish, French, Portuguese, and German.
Tis a refreshing bit of simplicity in this complex, vibe-coded world.
FIN
Remember, you can follow and interact with the full text of The Daily Drop’s free posts on:
- 🐘 Mastodon via
@dailydrop.hrbrmstr.dev@dailydrop.hrbrmstr.dev - 🦋 Bluesky via
https://bsky.app/profile/dailydrop.hrbrmstr.dev.web.brid.gy
☮️

Leave a comment