Hollama; Tactile Vega-Lite; Pussh
The brutality of the week did not cease, and I sidelined myself yesterday by spending the scant few personal compute cycles transcribing and enriching the daft tariff data, so no theme today, but I finally jot my thoughts about Hollama down, and dusted off an old tool that I’m surprised it took me this long to write about.
If able, join a few hundred thousand (hopefully more) of us tomorrow as we send a clear message to this administration that we are not taking things lying down.
TL;DR
(This is an LLM/GPT-generated summary of today’s Drop using Ollama + llama 3.2 and a custom prompt.)
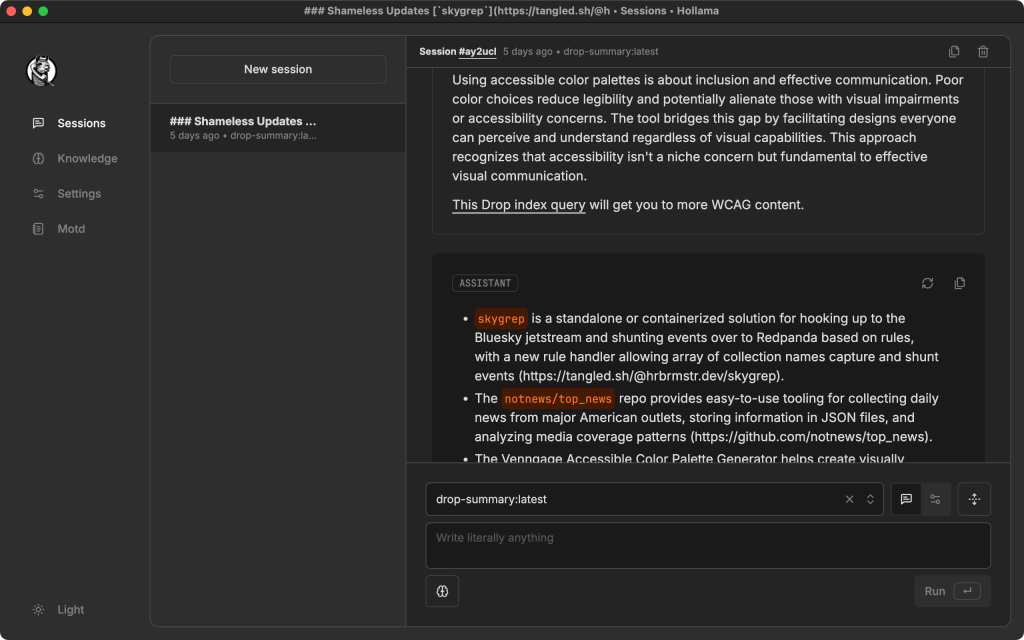
- Hollama summary (https://hollama.fernando.is/motd) is a minimal web interface for interacting with LLMs, featuring a clean UX, markdown rendering, and multi-language support, making it easy to use for beginners and advanced users alike.
- Tactile Vega-Lite (https://arxiv.org/html/2503.00149v2) extends visualization tools for blind and low vision readers by providing tactile-specific abstractions and smart defaults, addressing the need for accessible charts that can be navigated in a “part-to-whole” sequence.
- Pussh (https://github.com/bearstech/pussh) is a parallel SSH tool for executing commands across multiple servers simultaneously, supporting piping input to and output from SSH sessions, and enabling features like script execution and sorting servers by root filesystem usage.
Hollama
I’ve been super happy with the M4 Mac Mini acquisition as it has enabled me to move the vast majority of my LLM/GPT tinkering to a local-first mode. I’m also always on the lookout for new interaction UIs and came across Hollama (GH) a few weeks ago. It’s been a pleasant experience, so it’s time to blather about it in the Drop.
Hollama is a [not-too-]minimal, accessible web interface built to simplify interaction with our LLM overlords running on Ollama servers or through OpenAI-compatible APIs. It’s Electron (sigh), but has a well conceived UX and hasn’t misbehaved like Slack and other Electron-based apps usually do. It sports large, comfortable prompt fields; markdown rendering with syntax highlighting; light and dark themes for visual comfort; and multi-language support including English, Spanish, Turkish, and Japanese. Output can be easily copied as raw text or formatted markdown, just like the commercial services.
The layout is clean and intuitive, with four clearly defined areas: Session (for interacting with the model), Knowledge (to develop and tweak model files), Settings (for choosing models and preferences), and MOTD (for updates and announcements). This structure makes it easy to locate features and stay focused.
Getting started with Hollama is straightforward. You can play with online demo (everything is stored in browser local storage), which — refreshingly — doesn’t require sign-up. Alternatively, you can download platform-specific builds or self-host via Docker with a simple command.
Despite its minimalist appearance, Hollama includes advanced capabilities like customizable system prompts, a built-in code editor, separate output formatting for code and markdown, and session memory. These features strike a balance between simplicity and power, making the tool accessible to beginners while still being useful for more experienced users. However, if you keep working in a given session, it does re-send all the content, which eventually slows down local Ollama models (at least on Apple Silicon).
Development is also fairly active, with multiple contributors continuously improving the project.
The section header is an example of me using my custom Modelfile that powers the TL;DR portion of the Drop, though I usually just use Zed’s Assistant panel, which is also wired up to that same setup.
Tactile Vega-Lite
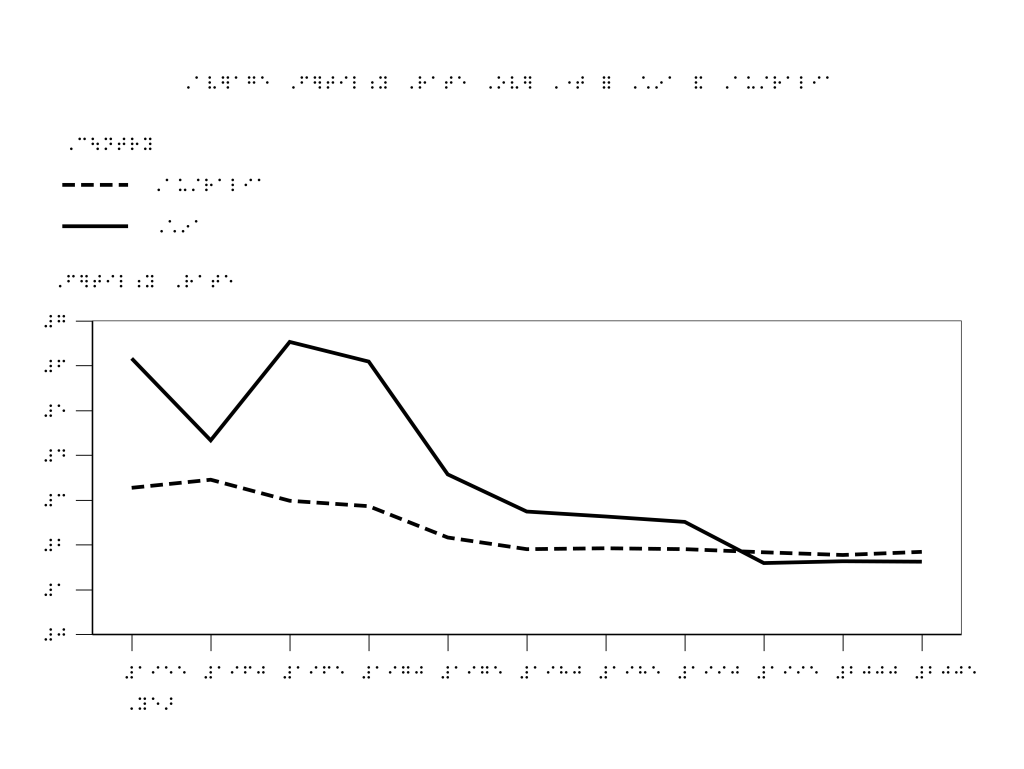
Tactile Vega-Lite (TVL) extends the Vega-Lite grammar to enable rapid prototyping of tactile charts for blind and low vision (BLV — an acronym I was not aware of until this paper) readers. The system addresses a major gap in current visualization tools by providing tactile-specific abstractions and smart defaults that synthesize complex design guidelines into an accessible framework.
While visual charts can optimize for space efficiency and aesthetics through techniques like scaling text or orienting it sideways, these approaches fail in tactile design. Braille cannot be scaled, and changing its orientation renders it unreadable. The process of creating tactile charts has traditionally been fragmented across multiple tools, requiring designers to master vector drawing applications like Adobe Illustrator alongside specialized braille translation software. They usually face a workflow that involves:
- Consulting complex guidelines spanning hundreds of pages
- Tracing visual references in vector graphics software
- Manually adjusting spacing and layout for tactile perception
- Translating text to braille using separate software
- Iterating through preview tools to check production compatibility
This process is not only time-consuming but requires deep expertise in tactile design principles that many educators and designers lack. Teachers of students with visual impairments often resort to more manual approaches using physical materials like braille graph paper due to time constraints, despite the lower accuracy and consistency of the resulting charts.
TVL introduces domain-specific abstractions for tactile chart design that address these challenges through four key components.
- tactile encodings
- braille integration
- navigational aids
- layout configuration
Unlike visual charts that rely heavily on color, tactile charts must use textures and line styles that are perceptually distinct by touch. TVL provides a default palette of ten fill textures (including patterns like diagonal lines, dots, and cross-hatching) and four line styles (solid, dashed, dotted, and long-dashed) that have been designed for tactile distinctiveness.
The system intelligently assigns these encodings based on data characteristics, with built-in constraints that prevent cognitive overload. For example, it alerts designers when more than five textures are used, as research shows this can make it difficult for readers to learn and recall the mapping between textures and data values.
TVL implements braille translation using the open-source LibLouis library, automatically handling the complex rules of Unified English Braille (UEB). The system defaults to Grade 2 contracted braille, which incorporates abbreviations and shorthand symbols, while allowing customization for different reader needs or production methods.
Tactile readers explore charts in a fundamentally different way than visual readers. While sighted individuals typically grasp visual graphics in a “whole-to-part” manner, blind readers usually explore tactile graphics in a “part-to-whole” sequence, building up an understanding by examining individual elements.
TVL implements a clear information hierarchy among navigational elements like grid lines, axes, and tick marks. This hierarchy is expressed through variations in line styles, thickness, and placement, with smart defaults that follow established guidelines. For example, grid lines are rendered as the least tactually distinct lines, while data lines are the most prominent.
The system manages the positioning, spacing, alignment, and orientation of chart elements to enhance readability. By default, the chart title is centered at the top, legends are positioned directly below the title, and spacing between elements follows the guideline recommendation of at least 1/8 inch to ensure tactile discernibility.
There’s tons more in the paper (which is an refeshingly accessible read), and I live close enough to MIT that I might just make a trip down there to experience the TVL output IRL.
Pussh
Pussh is a handy parallel SSH tool for executing commands across multiple servers simultaneously. Remote command output is prefixed with the hostname for easy identification, and host lists can be specified directly in the command line or read from a file or stdin.
The tool supports piping input to and output from SSH sessions, and the -u option enables sending and executing scripts on remote hosts in a single operation.
Basic command execution:
$ pussh -h host1,host2bis,... uname -a
Reading hosts from a file:
$ pussh -f servers uname -a
Sorting servers by root filesystem usage:
$ pussh -f servers df -h / | grep /dev | sort -rn -k5
Collecting per-host output:
$ pussh -f servers -o %h-hw.txt lshw
Sending and executing a script:
$ pussh -f servers -u my-deploy.sh args ...
This tool has been around for quite a while, so many rough edges have been sanded off, and it “just works”.
In this time of incredibly powerful single-node setups, Pussh may not be as necessary as it used to be. But, many of us still run multi-node clusters, or at least have standardized on a single OS/config across a diverse fleet, making some subset of common CLI taks easier to orchestrate with this handy tool.
FIN
Remember, you can follow and interact with the full text of The Daily Drop’s free posts on:
- 🐘 Mastodon via
@dailydrop.hrbrmstr.dev@dailydrop.hrbrmstr.dev - 🦋 Bluesky via
https://bsky.app/profile/dailydrop.hrbrmstr.dev.web.brid.gy
☮️

Leave a comment