Gephi Lite; Travel Time; Tagging Prompts
The theme today is super-useful resources, whether it’s to help dig into relationships, figure out where you’re going, or wresting control of your content library.
TL;DR
(This is an LLM/GPT-generated summary of today’s Drop using Qwen/Qwen3-8B-MLX-8bit with /no_think via MLX, a custom prompt, and a Zed custom task.)
- Gephi Lite is a lightweight, browser-based tool for network visualization, offering a subset of Gephi’s features with no installation required. It leverages WebGPU and worker threads for performance, allowing users to explore complex graphs on mobile devices. The tool is privacy-friendly, browser-only, and supports loading data from GEXF, GraphML, and GitHub Gists. (https://lite.gephi.org/v1.0.0/)
- Travel time isochrones depict areas reachable within a specific time threshold, accounting for real-world travel conditions like road networks and speed limits. The concept dates back to the 1880s, with modern applications using shortest-path algorithms to generate isochrone maps. Tools like R packages and free services provide interactive and API-based access to isochrone generation. (https://en.wikipedia.org/wiki/Isochrone_map)
- The Obsidian AI tagger provides prompts for efficient tagging in note-taking systems, including hybrid modes that combine from-scratch and existing tag corpus. The tool is designed for lazy users and offers quick results for organizing content. (https://github.com/niehu2018/obsidian-ai-tagger-universe/blob/main/src/services/prompts/tagPrompts.ts)
Gephi Lite
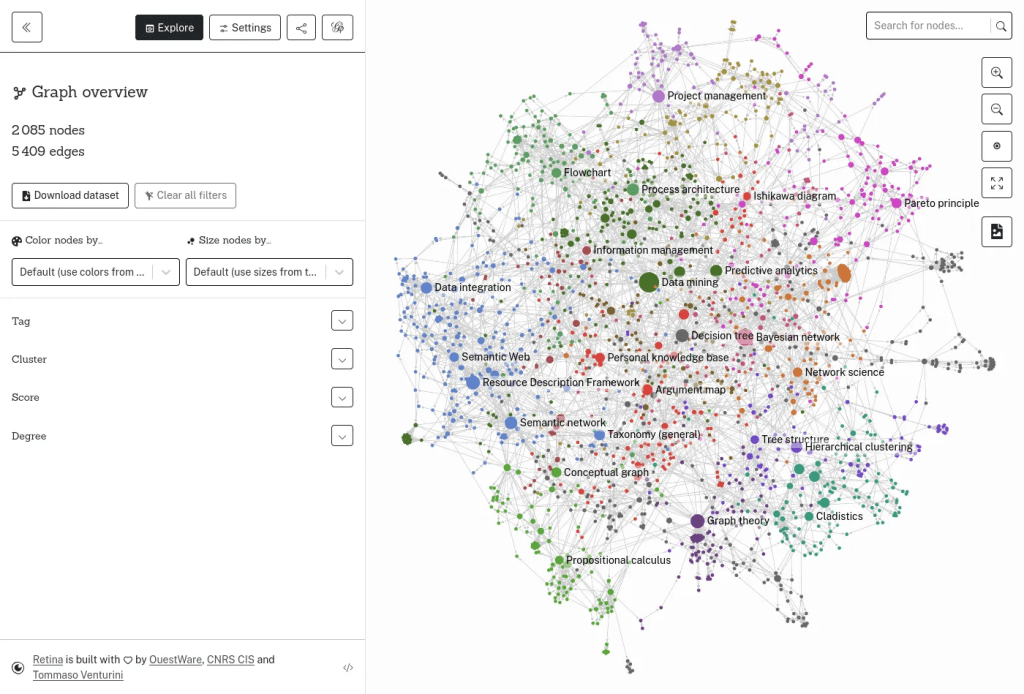
A great deal of my professional work involves understanding relationships between “nodes” and events. I end up using the extended {igraph} ecosystem (including the modern tidy adapters to it) quite a bit, but I sometimes have a complex enough graph that requires loading up some external tool/app. When that happens I usually turn to Gephi, one of the classics that is still going strong, but has definitely not kept up with modern UX idioms.
So, I was elated to discover Gephi Lite! It has a substantial subset of the power of Gephi-proper, with the installation pain stripped away, and available in your browser, taking full advantage of WebGPU, worker threads, and more. This makes it an open, privacy-friendly playground for network visualization that now literally “just works”. No downloads. No setup. No data leaving your computer.
It was built by OuestWare and born out of over a decade of research, it’s been around since 2022 quietly doing the heavy lifting for anyone who needs to explore graphs on the fly. And, I somehow missed all of that until recently.
The interface is super modern, and it even has non-desktop/laptop folks in mind. That means you can tap, pinch, and zoom your way through complex networks even on your iPad.
You can load graphs from GEXF, GraphML, or (soon?) CSV files, or even connect to GitHub to save and load your visualizations as Gists. While it’s not meant for the truly massive datasets that desktop Gephi can handle, it’s perfectly comfortable managing thousands of nodes and edges. Once your data is in, you can start running stats like community detection (using the Louvain algorithm), PageRank, degree and betweenness centrality, and modularity. It’s a full toolkit for getting a sense of what’s connected to what and how tightly.
Then comes the fun part—making your graph look alive. You can size and color nodes by their metrics, watch the (EPIC) Force Atlas 2 layout algorithm push and pull your network into a balanced form, and filter down to only the pieces that matter. The workflow feels super natural: import, analyze, layout, customize, filter, export. You can save your graph as a GEXF, export an image, or share it through GitHub in seconds.
For the tinkerers, Gephi Lite can be embedded into other web apps or controlled directly from JavaScript. There’s even TypeScript support for building more advanced setups. The interface is tidy and intuitive: a central graph window for visual play, a data table to peek at your raw nodes and edges, and panels on the side to tweak appearance, layout, and filters. Label management is simple and performance is surprisingly smooth, though you’ll still want desktop Gephi if you’re working with enormous, hairy datasets.
I won’t be dragging the Gephi app proper to the recycle bin, but I will certainly be reaching for this Lite version first from now on.
Travel Time

While I do get to work with graph networks regularly, I have very little opportunity to even do recreational GIS work these days. A recent thread on Mastodon reminded me of isochrones — a depiction of the area accessible from a point within a certain time threshold, where “iso” means equal and “chrone” means time. These maps essentially show lines drawn surface connecting points at which something occurs or arrives at the same time. Think of them as “travel time bubbles” that show you everywhere you can reach within, say, 15 or 30 minutes from a starting point.
Unlike simple distance circles, isochrone maps account for real-world travel conditions. A 10-minute drive doesn’t create a perfect circle around your location – it creates an irregular shape based on road networks, speed limits, traffic patterns, and geographic barriers like rivers or mountains.
The concept dates back to the 1880s, with early examples including Francis Galton’s Isochronic Postal Charts (1881-1882) and Albrecht Penck’s Isochronenkarte (1887) Isochrone map. While these early pioneers mapped travel times in days or weeks for long-distance journeys, modern isochrone maps can show travel times down to the minute for local areas.
Modern isochrones are typically computed by generating shortest-path trees on network graphs, then creating a convex hull around the accessible nodes. The process involves:
- Starting Point Selection: Choose your origin location
- Time/Distance Parameters: Set maximum travel time (e.g., 30 minutes) or distance
- Transportation Mode: Select walking, cycling, driving, or public transit
- Algorithm Processing: The system calculates all possible routes within your parameters
- Visualization: Results appear as colored zones or contour lines on the map
The Mastodon thread linked to a $$-only resource, but you don’t need to drop coin to make these maps.
There’s a nice R package and at least one — https://www.iso4app.net/demo.jsp — free[mium] service (both interactive and API) to get you started.
This could be a fun activity to get into during the coming cold, dark days of winter (if you’re in my hemisphere).
Tagging Prompts

I do not use Obsidian, but I do use Joplin, and am a very lazy note-taker. I’ve never been good at interjecting those #tags into any note system to help with “knowledge graph” building, since I’m still (foolishly) relying on my temporal eidetic memory to do my human RAG work.
A few months ago, I tidied up my Raindrop.io bookmarks (I also never add tags to those O_o) by hacking their hidden “AI note adder” API with their documented bookmarks managment API to get the multi-multi-thousand set of bookmarks under a bit more control.
Recently, I came across a really nice Obsidian AI note tagger that has multiple modes — tags from scratch, tags from a pre-defined list, and tags from a hybrid approach of from-scratch and existing corpus of tags in across all notes. Obviously, I cannot use that for Joplin, but I can steal/borrow their spiffy prompts.
The work really well with the tinier, local models I keep harping about, and provide near instant results, making quick work of the tagging.
Clone the repo, adapt the prompts, and start unraveling the rat’s nest of your own content (assuming you’re as lazy as I am).
FIN
Remember, you can follow and interact with the full text of The Daily Drop’s free posts on:
- 🐘 Mastodon via
@dailydrop.hrbrmstr.dev@dailydrop.hrbrmstr.dev - 🦋 Bluesky via
https://bsky.app/profile/dailydrop.hrbrmstr.dev.web.brid.gy
☮️

Leave a comment