pagemap; Spectrum; The “Pause”
Today, we explore three diverse technical topics that showcase both innovative solutions and thoughtful reflections on modern development practices. From elegant webpage navigation to comprehensive data visualization guidelines and the psychological impact of AI coding tools, there should be at least one item that takes your mind off of — gestures outward — for at least a little while.
TL;DR
(This is an AI-generated summary of today’s Drop using Ollama + llama 3.2 and a custom Modelfile.)
- A tiny JavaScript library called ‘pagemap’ enables creation of minimaps for webpage navigation, offering a more compatible alternative to CSS element() function (https://github.com/lrsjng/pagemap)
- Adobe’s Spectrum design system provides comprehensive guidelines for data visualization, covering axes, legends, and various chart types with focus on accessibility and responsive design (https://spectrum.adobe.com/page/axis/)
- “The Copilot Pause” describes the cognitive hiccup when AI code completion tools are disabled, highlighting concerns about skill erosion and suboptimal code generation (https://thomasvogelaar.me/posts/the-copilot-pause/)
pagemap
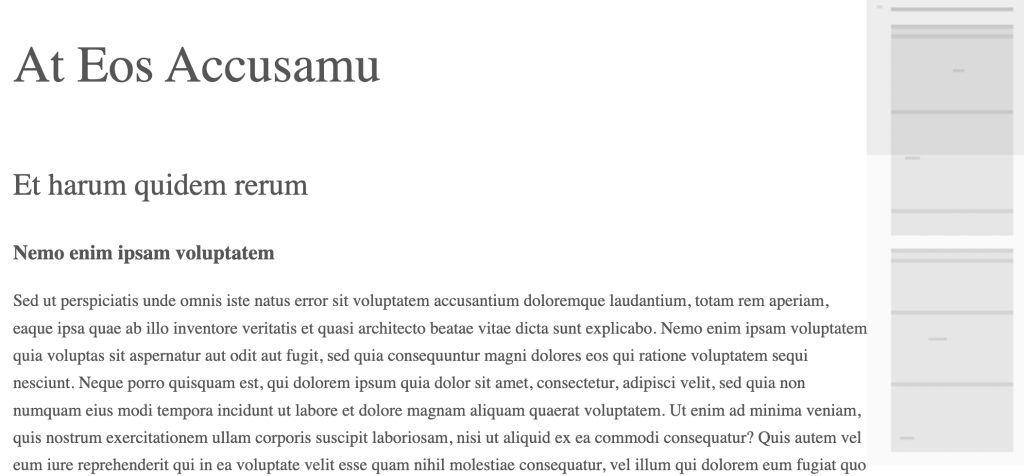
A “minimap” is a miniaturized preview of a long document or webpage that appears on one side of the screen, typically used for navigation purposes. Most folks are familiar with minimaps from code editors like Sublime Text, where they provide an overview of the entire document’s structure.
The most straightforward way to create a minimap involves using CSS element() function, which allows creating a live preview of another element as a background image. This approach works particularly well in Gecko-engine-based browsers (I’m trying to never use the “F” word again) but has limited browser support. CSS Tricks has a great explanation of this method.
A more broadly compatible implementation can be achieved using a combination of HTML, CSS, and JavaScript to handle the scrolling behavior, and I came across a pretty elegant and tiny implementation of this approach which does not require much extra code to take advantage of it:
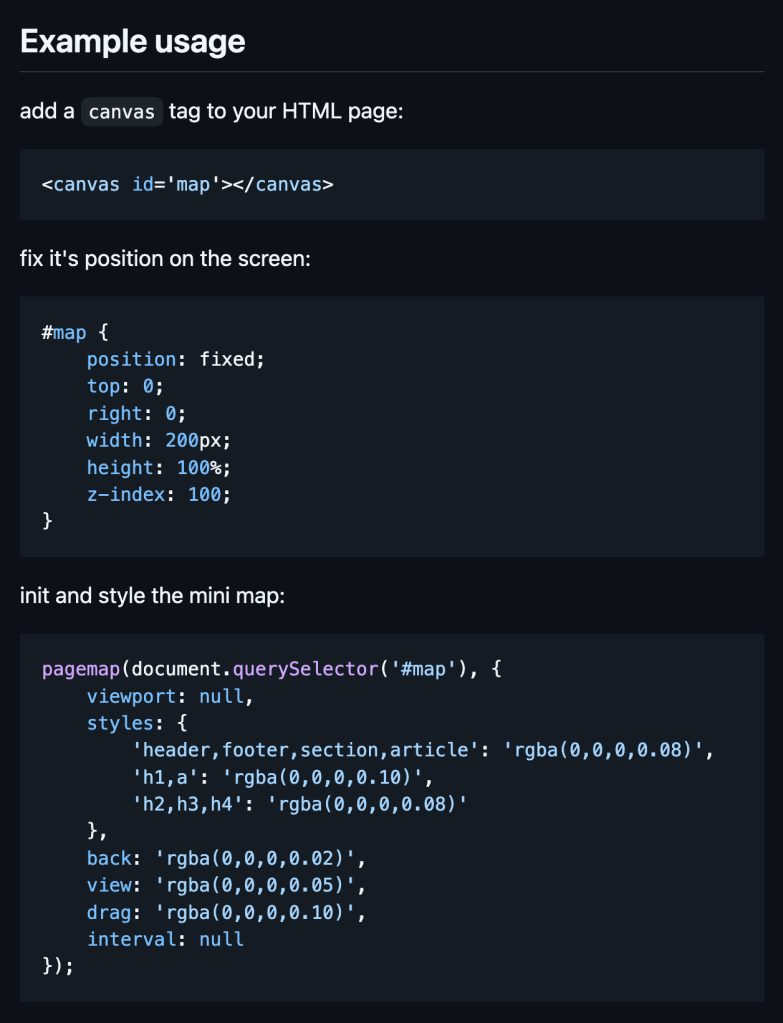
While Lars (the author) has two demos in the distribution, they are not “online” (i.e., you have to do some work to preview them). So, I put up the text and boxes examples up for y’all to view. Since you control the CSS for the minimap, you have some flexibility in the presentation.
Spectrum
Adobe’s Spectrum design system provides a comprehensive framework for creating consistent, accessible data visualizations across Adobe’s product ecosystem. The system’s approach to data visualization components reflects a deep understanding of both perceptual psychology and practical implementation needs. It represents a thoughtful balance between statistical rigor and practical implementation needs, particularly valuable for teams building data-heavy enterprise applications. The system’s approach to accessibility and responsive design provides a solid foundation for creating visualizations that work across devices while maintaining compliance with modern accessibility standards.
Now, I’m not suggesting you use Adobe’s JS libraries for datavis, but I am asserting that it is worth the scant few minutes it takes to read through their suggestions/guidelines and see which ones might be useful in the next few projects you undertake. There aren’t many sections, so let’s take a brief look, here (you’ll need to hit the site for the details).
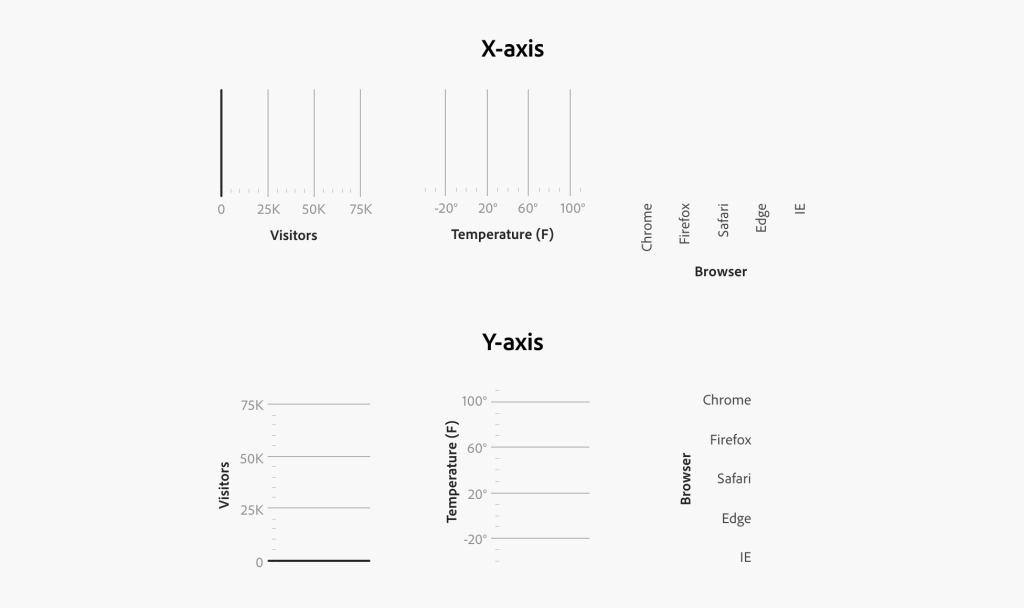
The “Axis” system forms the foundation of most quantitative visualizations, supporting both continuous and discrete scales. It handles time series particularly well, with built-in support for various temporal granularities and thoughtful date formatting. The system includes smart label collision detection and implements responsive tick mark density.
“Legends” are treated as first-class interface elements, not mere appendages to charts. Ideally, your use should support interactive filtering, maintain consistent positioning rules, and implement WCAG 2.1 accessibility standards, including proper contrast ratios and keyboard navigation.
The “Histogram” and “Scatter Plot” implementations show particular attention to statistical literacy. Histograms should use well-considered bin width optimization and density estimation options, while scatter plots should handle overplotting through techniques such as intelligent opacity scaling and jittering.
“Line” and “Bar” charts should implement best practices for perceptual accuracy, including zero-baseline enforcement for (most) bars and appropriate aspect ratio constraints for line charts to prevent visual distortion of trend lines.
Adobe suggests “Big Number” and “Donut” chart components be used in dashboard contexts, with careful attention to typography scaling and appropriate use of color to maintain hierarchy without overwhelming other visualization elements.
One aspect of Adobe’s Spectrum “rules” is that they make note to consider edge cases — from handling missing data to dealing with extreme aspect ratios — which often consume disproportionate development time when building visualization systems from scratch.
FWIW, digging in and making your own set of datavis design system guidelines would be a great way to both improve your work and keep your mind off of certain recent events.
The “Pause”

I was going to save this for a “ThursdAI” issue of the Drop, but it was a good read with good advice that also put a name to something I’ve taken note of since November of 2022.
The concept of “The Copilot Pause” describes a peculiar cognitive phenom that occurs when we temporarily disable AI code completion tools like Sourcegraph’s Cody. This pause manifests as a brief mental hiccup where we find ourselves staring at the screen, unconsciously waiting for automated suggestions that won’t appear.
The pause typically occurs during mundane programming tasks such as writing unit tests, basic functions, and conditional statements. While AI code completion is often fairly adept at generating syntactically correct code, it lacks understanding of the crucial “why” behind programming decisions.
Regular reliance on AI completion tools can lead to the gradual erosion of fundamental programming skills. Let’s be clear, however, that folks said the same thing about all the non-AI bells and whistles IDEs have added over the years. While the traditional IDE tooling does speed up coding tasks, we may find ourselves slowly outsourcing even basic implementation details to the AI helper. In doing so, we may miss valuable opportunities to reinforce our own understanding of language intricacies and problem-solving patterns. AI completion tools also seem to regularly rely on deprecated, or at least “outdated”, idioms. Both of these situations can foster technical debt when it comes to human capital, where short-term efficiency gains may come at the cost of long-term technical mastery.
What’s more, the automated approach often results in codebases filled with suboptimal choices in data structures, error handling, and documentation. These decisions, while individually minor, accumulate over time and frequently lead to increased code churn as teams need to refactor AI-generated code that prioritized popularity over appropriateness for specific use cases.
Thomas Vogelaar (the author) suggests a deliberate practice of disabling AI code completion tools for extended periods to maintain and sharpen programming skills. This approach, while potentially reducing short-term productivity, helps developers maintain their technical edge and deeper understanding of the code they write.
It’s a good, distracting read.
FIN
We all will need to get much, much better at sensitive comms, and Signal is one of the few ways to do that safely in modern times. You should absolutely use Signal if you are doing any kind of community organizing (etc.). Ping me on Mastodon or Bluesky with a “🦇?” request (public or faux-private) and I’ll provide a one-time use link to connect us on Signal.
Remember, you can follow and interact with the full text of The Daily Drop’s free posts on Mastodon via @dailydrop.hrbrmstr.dev@dailydrop.hrbrmstr.dev ☮️

Leave a comment