DuckPlot; MCP Viz For DuckDB; Caffeinated DuckDB
This seems like a good day for another waterfowl edition of the Drop, especially since there’s been a ton going on in the world of our fav web-footed database ecosystem.
TL;DR
(This is an LLM/GPT-generated summary of today’s Drop using Ollama + Qwen 3 and a custom prompt.)
- DuckPlot is an open-source JavaScript library that allows generating charts directly from DuckDB instances using a unified configuration, eliminating the need for separate SQL and charting code (https://www.duckplot.com/)
- The
mcp-visualization-duckdbpackage provides a conversational interface between Claude Desktop and data sources, enabling users to request visualizations in plain English without writing SQL (https://pypi.org/project/mcp-visualization-duckdb/) - The DuckDB-QuickJS project embeds the QuickJS-NG JavaScript engine into DuckDB, allowing JavaScript code execution within SQL queries for flexible data processing (https://github.com/quackscience/duckdb-quickjs)
DuckPlot
DuckPlot (GH) an open-source JavaScript library designed to bridge the gap between DuckDB and modern data visualization. It lets us generate charts directly from DuckDB instances using a single, unified configuration that specifies what you want to see, rather than requiring you 🫵🏽 to separately write SQL for data wrangling and then configure a charting library for visualization.
The framework is is built on top of Observable Plot (💙) and D3. The end result is that data aggregation, transformation, and pivoting happen efficiently at the database layer, and the results are formatted automatically for visualization. No more manual data export, transformation, or repetitive code!
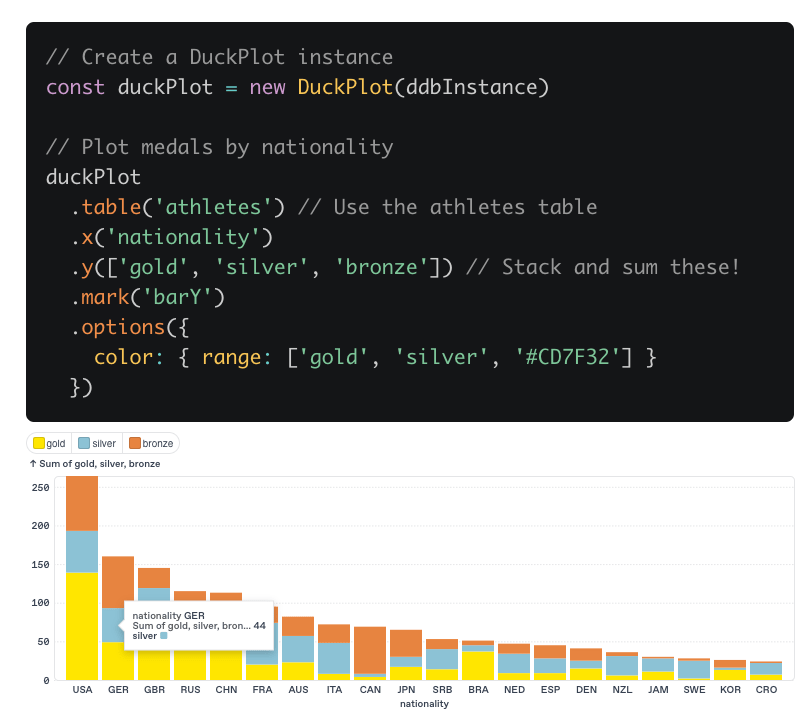
The workflow is straightforward: you instantiate DuckPlot with a DuckDB instance, then use a concise, chainable API to specify the table, axes, marks (chart types), and options. For example, to create a stacked bar chart of Olympic medals by nationality, you might write:
const duckPlot = new DuckPlot(ddbInstance)
duckPlot
  .table('athletes')
  .x('nationality')
  .y(['gold', 'silver', 'bronze'])
  .mark('barY')
  .options({ color: { range: ['gold', 'silver', '#CD7F32'] } })
The above configuration tells DuckPlot to generate the necessary SQL to aggregate medal counts by nationality, pivot the data into a form suitable for a stacked bar chart, and then render the chart using Observable Plot.
Key features include:
- Automatic SQL Generation: DuckPlot writes and executes the SQL needed for data aggregation, pivoting, and filtering, so you don’t have to. You can inspect the generated SQL with
.queries()or get a human-readable summary with.describe(). - Flexible Aggregation: Supports
sum,mean,min,max, and custom aggregations directly in the configuration. - Percentage Calculations: Can compute percentages at the database level, not just in JavaScript, for more accurate and efficient results.
- Direct SQL Support: If you prefer, you can provide your own SQL queries using
.query(), and DuckPlot will handle the rest. - Advanced Chart Types: Beyond standard bar and line charts, DuckPlot supports pie charts, treemaps, circle packs, grouped bar charts, and faceted charts.
- Interactivity and Layout: Features like interactive legends and automatic margin/label adjustments are built-in, reducing the need for manual tweaking.
- Server and Client Compatibility: Works in both browser and server environments, supporting DuckDB WASM and async wrappers. (For consistent results, an explicit
ORDER BYis recommended.)
DuckPlot can also work with raw data (e.g., CSVs) if you don’t have a DuckDB instance, though you lose the automatic SQL generation in that case. The library is installable via npm and is designed to be used in any JavaScript environment, not just full web apps.
Having caught the “widget” bug (if you track my social media posts you know what that is), I spent way too much time trying to tranfer my iOS widget skills to macOS this morning, and ran into several brick walls until getting what I wanted working, so we’ll work through some examples of DuckPlot in future Drop.
MCP Viz For DuckDB

While I suspect most Drop readers are proficient in SQL, most folks who actually need to get insights from data are not. Since we’ve “data”, there has been the need to turn human speak, such as “What are our top-performing regions?”, and the technical gymnastics required to answer them (SQL queries, chart configurations, data wrangling, etc.). The mcp-visualization-duckdb package tackles this divide head-on, and the result is…interesting.
This isn’t just another database connector, or MCP “SQL” tool. The service creates a conversational interface between Claude Desktop and your data, whether that’s local DuckDB files or enterprise Databricks warehouses. What they claim can be done is pretty big: just describe what you want in plain English and get interactive visualizations without touching a line of SQL.
So, instead of the traditional workflow of:
- Write SQL query
- Export results
- Import to visualization tool
- Configure chart parameters
- Iterate and refine
You get:
- “Show me sales by region as a bar chart”
- Done.
The natural language processing is contextually aware if all the tables and fields at your disposal. And, yo can ask follow-up questions, request different chart types (the project uses Plotly), or drill down into specific data segments, and the system maintains conversation state. The term floating around for a workflow like this is “GenBI” (generative biz intelligence), which we will happily never use again.
Now, the MCP ecosystem is still being baked, but mcp-visualization-duckdb is one of the more “higher order” MCP servers that showcases the protocol’s potential. Unlike generic database MCP servers that focus on querying and table management, this package optimizes for the specific workflow of conversational data analysis.
Compared to traditional BI tools, it’s less feature-complete but infinitely more approachable. Compared to notebook environments (ugh), it’s less flexible but far more conversational. It occupies an interesting middle ground that is sophisticated enough for serious analysis, but also simple enough for casual exploration.
I did have time to play with this (though it took some wrangling due to some [ugh] Python dependency Hades), and it does what it says on the tin. But, I’m not going to show any “report pages” from it until I find out if it was Claude making absolutely horrible design choices (both palettes and layouts) or if that’s baked into the MCP server.
Caffeinated DuckDB

The DuckDB-QuickJS project is a DuckDB extension that embeds the QuickJS-NG JavaScript engine directly into DuckDB, enabling you to execute JavaScript code from within SQL queries. This integration allows for a high degree of flexibility in data processing and analysis, combining the functional expressiveness of JavaScript with the performance and convenience of DuckDB’s analytical SQL engine.
This is not a Community extension yet, so you will need to build it (a task not for the weary), and it does require DuckDB 1.3.1.
The README has some very basic examples, but I wanted to show one that worked on “real” data:
$ duckdb --unsigned
> LOAD '/PATH/TO/duckdb-quickjs/build/release/extension/quickjs/quickjs.duckdb_extension';
> CREATE TABLE events AS (FROM read_csv('~/Downloads/id-eventtype-payload.csv'));
> FROM events;
┌───────┬────────────┬────────────────────────────────────────────────────────────────────────────────┐
│  id   │ event_type │                                    payload                                     │
│ int64 │  varchar   │                                    varchar                                     │
├───────┼────────────┼────────────────────────────────────────────────────────────────────────────────┤
│     1 │ login      │ {"user":"alice","ip":"192.168.1.2","meta":{"device":"mobile","os":"iOS 17.2"}} │
│     2 │ login      │ {"user":"bob","ip":"10.0.0.5","meta":{"device":"desktop","os":"Windows 11"}}   │
│     3 │ purchase   │ {"user":"carol","amount":19.99,"meta":{"item":"book","category":"fiction"}}    │
└───────┴────────────┴────────────────────────────────────────────────────────────────────────────────┘
FROM events
SELECT
  id,
  event_type,
  quickjs_eval(
    '(event_type, payload) => {
      let data = JSON.parse(payload);
      if (event_type === "login") {
        return {
          user: data.user,
          device: data.meta.device,
          os: data.meta.os
        };
      } else if (event_type === "purchase") {
        return {
          user: data.user,
          item: data.meta.item,
          category: data.meta.category,
          amount: data.amount
        };
      } else {
        return null;
      }
    }',
    event_type, payload
  ) AS extracted;
┌───────┬────────────┬────────────────────────────────────────────────────────────────────┐
│  id   │ event_type │                             extracted                              │
│ int64 │  varchar   │                                json                                │
├───────┼────────────┼────────────────────────────────────────────────────────────────────┤
│     1 │ login      │ {"user":"alice","device":"mobile","os":"iOS 17.2"}                 │
│     2 │ login      │ {"user":"bob","device":"desktop","os":"Windows 11"}                │
│     3 │ purchase   │ {"user":"carol","item":"book","category":"fiction","amount":19.99} │
└───────┴────────────┴────────────────────────────────────────────────────────────────────┘
I’m sure I can come up with a better example of why you’d do this over the built-in DuckDB JSON ops.
Current features include:
- Full ES2020 JavaScript Support: The embedded QuickJS-NG engine supports modern JavaScript features, including arrow functions, template literals, and more.
- Automatic Type Conversion: Data types are automatically converted between DuckDB and JavaScript, streamlining interoperability.
- Error Handling: JavaScript errors are surfaced as DuckDB exceptions, providing clear feedback within SQL workflows.
- State Isolation: Each function call is fully isolated, so no state leaks between calls—this is important for reproducibility and security.
I’ll likely wait until this shows up in the Community extensions directory before playing with it more.
FIN
Remember, you can follow and interact with the full text of The Daily Drop’s free posts on:
- 🐘 Mastodon via
@dailydrop.hrbrmstr.dev@dailydrop.hrbrmstr.dev - 🦋 Bluesky via
https://bsky.app/profile/dailydrop.hrbrmstr.dev.web.brid.gy
☮️

Leave a comment