GoAccess; lnav; agrind
We’ve all got’em, and most of us dread needing to have to look at them, as it usually means something’s gone awry.
Yep. We’re talking about log files. Dozens. Hundreds. Thousands…of log files. Of every shape, sort, and size.
Today we present three resources (one from “back in my day”, that is still cranking through text files, today) to help you get a handle on what your logs might be saying to you. Though, if you actually hear them saying something (and, you’re not using a screen reader), you have far more issues that what may lie in those files.
There should be something for any developers, system administrators, and data crunchers who regularly work with log files to troubleshoot issues, monitor systems, or analyze application behavior.
GoAccess

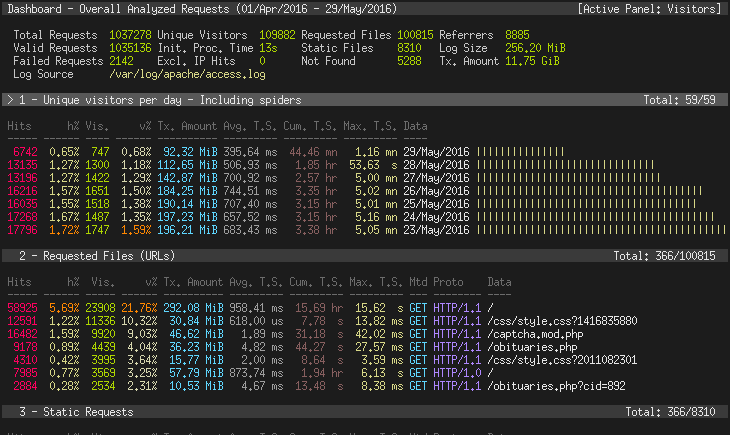
GoAccess (GH) is, for me, a blast from the past. It’s a pretty spiffy log file analyzer that offers a real-time, terminal-based, and web-based interface for monitoring web server statistics. It’s designed to be a fast, and with it, you can parse virtually any web log format, including — but not limited to — Common Log Format (CLF), Combined Log Format (XLF/ELF), W3C format (IIS), and Amazon CloudFront (Download Distribution). This flexibility means we can analyze logs from a wide variety of sources without the need for extensive configuration or setup.
One neat feature of GoAccess is its ability to generate real-time, interactive reports that can be viewed in a web browser. This is achieved through its own websocket server, which pushes the latest data to the browser, allowing users to see up-to-the-minute information about their web traffic. This real-time analysis is particularly useful for quickly diagnosing issues or understanding traffic patterns as they happen.
GoAccess also supports incremental log processing. This means that it can process logs in chunks, keep track of what it has already analyzed, and then continue from where it left off. This feature is handy when analyzing large log files or for continuous monitoring over long periods. The tool can also output its data in various formats, including HTML, JSON, and CSV, providing flexibility in how the analyzed data is consumed and shared.
lnav

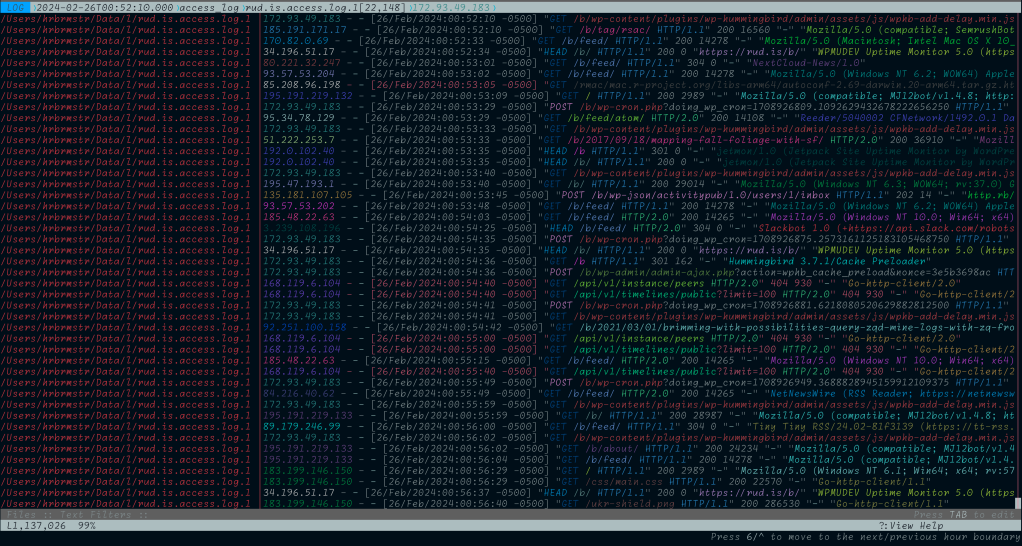
The Logfile Navigator, lnav (GH), is an “enhanced log file viewer that takes advantage of any semantic information that can be gleaned from the files being viewed, such as timestamps and log levels. Using this extra semantic information, lnav can do things like interleaving messages from different files, generate histograms of messages over time, and providing hotkeys for navigating through the file.” This terminal-based application also lets us merge, tail, search, filter, and query log files with ease. There’s no server to set up, no complicated configuration; just point it to a directory, and it takes care of the rest. The section header is it slupring up all my access logs.
It has direct knowledge of three particular, and one generic, log sources:
access_log: Apache common access log formatsyslog_log: Syslog formatstrace_log: Strace log formatgeneric_log: ‘Generic’ log format. This table contains messages from files that have a very simple format with a leading timestamp followed by the message.
The tool also has support for performing SQL queries on log files using the SQLite3 “virtual” table feature. For all supported log file types, lnav will create tables that can be queried using the subset of SQL that is supported by SQLite3. For example, to get the top ten URLs being accessed in any loaded Apache log files, we can execute:
;SELECT cs_uri_stem, count(*) AS total
 FROM access_log
 GROUP BY cs_uri_stem
 ORDER BY total
 DESC LIMIT 10;
Here’s the sad result on mine:

I really dislike staring at linux journalctl logs, but with journalctl | lnav they become way easier to triage.
Honestly, there’s so much packed into this tool that you really just have to try it out, which you can do without installing anything! Just do ssh playground@demo.lnav.org in a terminal and follow along with the tutorial.
Make sure to keep the extensive documentation link handy.
agrind

NOTE: the proper name of this tool is angle-grinder.
I cannot find better words than the author’s intro to the tool so here that is:
The [Rust-based] ag utility lets us “parse, aggregate, sum, average, min/max, percentile, and sort [our] data. [We] can see it, live-updating, in [our] terminal[s]. [It’s] designed for when, for whatever reason, [we] don’t have [our] data in graphite/ honeycomb/ kibana/ sumologic/ splunk/ etc. but still want to be able to do sophisticated analytics”.
“It can process well above 1M rows per second (simple pipelines as high as 5M), so it’s usable for fairly meaty aggregation. The results will live update in your terminal as data is processed. [What’s more, ag bundles a] bare bones functional programming language coupled with a pretty terminal UI.”
The basic premise is similar to that of jq: you feed it lines of text and filter + perform operations on them in a script you fit between quotes:
$ agrind '<filter1> [... <filterN>] | operator1 | operator2 | operator3 | ...'
Examples speak louder than templates.
I have to admit it was rather fun watching it live-update the counts of HTTP status codes across 53 (~220MB) of my rud.is main web server access logs
$ time cat rud.is.access.log*| agrind '* | apache | count by status'
status        _count
----------------------------
200           909037
301           98643
202           41206
304           39099
404           34667
206           8425
302           4615
403           3958
499           3427
405           1333
101           749
204           508
502           370
503           239
400           106
201           6
500           4
409           1

8.71s user 0.82s system 156% cpu 6.073 total
It supports defnining fields as named capture groups in regular expressions, which is pretty cool. For example, we can pick out the timestamp and path from all the GET requests in this synthetic Go Gin app log:
2024-02-26T12:00:01Z | INFO | 200 |   90ms | 192.168.1.1 | GET /api/v1/users
2024-02-26T12:00:02Z | INFO | 201 |   45ms | 192.168.1.2 | POST /api/v1/users
2024-02-26T12:00:03Z | INFO | 404 |   10ms | 192.168.1.3 | GET /api/v1/unknown
2024-02-26T12:00:04Z | INFO | 500 |  120ms | 192.168.1.4 | PUT /api/v1/users/123
2024-02-26T12:00:05Z | INFO | 200 |   78ms | 192.168.1.5 | GET /api/v1/posts
2024-02-26T12:00:06Z | INFO | 403 |   12ms | 192.168.1.6 | DELETE /api/v1/users/123
2024-02-26T12:00:07Z | INFO | 200 |   65ms | 192.168.1.7 | GET /api/v1/comments
2024-02-26T12:00:08Z | INFO | 422 |   47ms | 192.168.1.8 | POST /api/v1/posts
2024-02-26T12:00:09Z | INFO | 200 |   89ms | 192.168.1.9 | GET /api/v1/users/123/posts
2024-02-26T12:00:10Z | INFO | 204 |   15ms | 192.168.1.10 | DELETE /api/v1/posts/123
via:
$ cat gin | agrind '"GET " | parse regex "^(?P<ts>[^|]+).*GET (?P<path>.*)"'
[path=/api/v1/users]        [ts=2024-02-26T12:00:01Z]
[path=/api/v1/unknown]      [ts=2024-02-26T12:00:03Z]
[path=/api/v1/posts]        [ts=2024-02-26T12:00:05Z]
[path=/api/v1/comments]     [ts=2024-02-26T12:00:07Z]
[path=/api/v1/users/123/posts]        [ts=2024-02-26T12:00:09Z]
This example is from the README, but it shows how much nicer it is to do the processing in ag cs jq:
curl  https://api.github.com/repos/rcoh/angle-grinder/releases  | \
   jq '.[] | .assets | .[]' -c | \
   agrind '* | json
         | parse "download/*/" from browser_download_url as version
         | sum(download_count) by version | sort by version desc'
version       _sum
-----------------------
v0.6.2        0
v0.6.1        4
v0.6.0        5
v0.5.1        0
v0.5.0        4
v0.4.0        0
v0.3.3        0
v0.3.2        2
v0.3.1        9
v0.3.0        7
v0.2.1        0
v0.2.0        1
There are plenty more examples in the repo, and the author has a pretty cool blog post on the Rust journey taken to build the tool.
FIN
Remember, you can follow and interact with the full text of The Daily Drop’s free posts on Mastodon via @dailydrop.hrbrmstr.dev@dailydrop.hrbrmstr.dev ☮️
Leave a comment