ggsql & ggsql-viewer; chartli
Hopefully things slow down onboarding- and health-wise to get this newsletter back to some semblance of daily, sooner than later.
ggsql & ggsql-viewer
Posit (the folks behind RStudio, Shiny, and the tidyverse) quietly dropped an alpha release last week that has me intrigued: ggsql. It’s a standalone implementation of Wilkinson’s grammar of graphics expressed entirely as SQL syntax extensions. No R runtime. No Python. Just a self-contained binary (written in Rust, with a Jupyter kernel available via PyPI and a VS Code/Positron extension) that takes your existing SQL query, appends visualization clauses, and produces a Vega-Lite spec.
The premise is that you write a normal SQL query against whatever backend you have (DuckDB, Postgres, your data warehouse — tho it’s DuckDB-centric for now), then append a VISUALIZE clause that maps columns to aesthetics, followed by one or more DRAW layers:
SELECT date, revenue, regionFROM salesWHERE year = 2024VISUALIZE date AS x, revenue AS yDRAW line
That’s a line chart. Add DRAW point on the next line and you’ve layered a scatterplot on top. Add SCALE fill TO accent and FACET region and you’re off to the races. The composability that made ggplot2 dominant in R for almost two decades is fully intact here, expressed in a syntax any SQL practitioner can read without picking up a new language first (which, if you’ve ever tried onboarding analysts onto ggplot2 cold, is not a tiny task).
What separates this from “ggplot2 but SQL” lives in three specific design choices.
When you ask for a histogram over a billion rows, ggsql pushes the binning down to your SQL backend, so computation stays in the database. You transfer bin counts, not raw data, which is a fundamental difference from ggplot2 or matplotlib, which need to materialize the full dataset client-side before computing derived statistics. Boxplots, density estimates, regression lines – all pushed down.
Shipping a Rust binary into a CI pipeline, an AI agent’s sandbox, or a Quarto doc is a different proposition from bundling R or Python. The attack surface is smaller; the dependency tree is essentially nil. Posit’s clearly thinking about the LLM agent use case – they’ve already wired ggsql into querychat for natural-language-to-visualization workflows, and the structured syntax should be significantly easier for models to generate reliably than arbitrary plotting code.
Finally, the syntax is refreshingly honest SQL: VISUALIZE, DRAW, PLACE, SCALE, FACET, PROJECT, LABEL – these read like SQL clauses because they are. Thomas Lin Pedersen, Teun Van den Brand, George Stagg, and Hadley Wickham built 18 years of ggplot2 lessons into a clean-sheet design. UK spelling (VISUALISE) is supported, which also adds a touch of class to your code.
It’s alpha. The roadmap covers theming infrastructure, interactivity, spatial data support, a language server, and an end-to-end deployment flow through Posit’s commercial stack. The gallery already has a solid range of examples including a Minard-style Napoleon’s march reproduction, and there’s a WASM playground if you want to kick the tires without installing anything. I spent an afternoon in it – the edit-run-inspect loop is fast enough that the alpha label feels honest rather than cautionary.
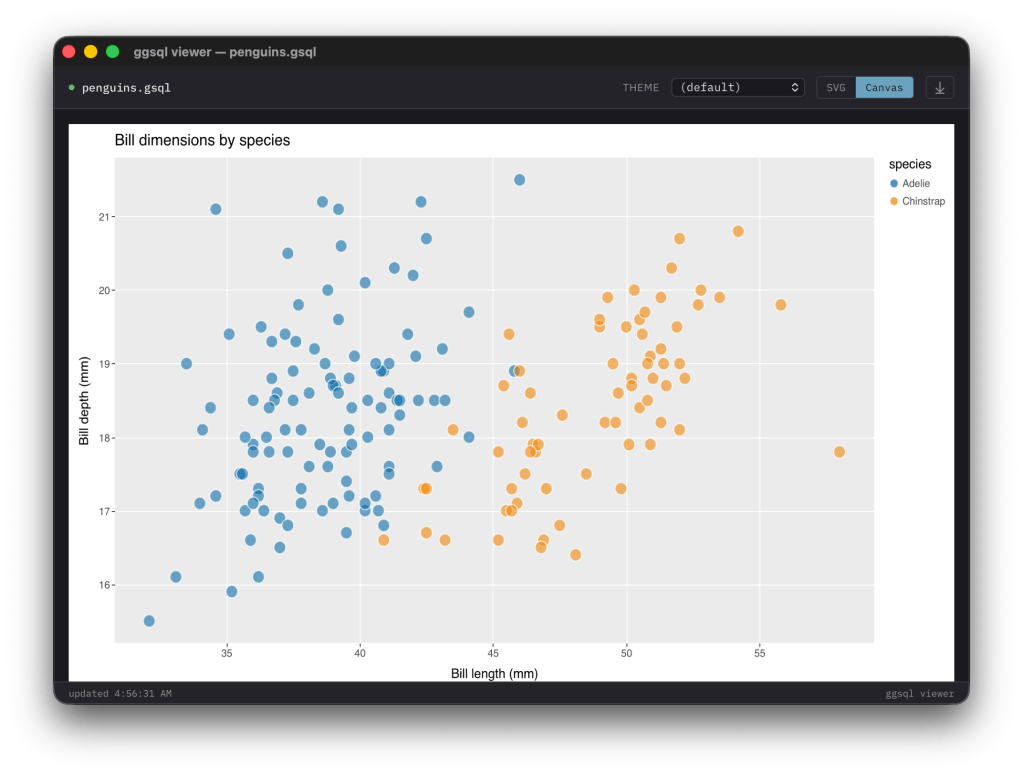
I was sufficiently taken with ggsql that I built ggsql-viewer, a native desktop viewer for iterating on .gsql files with live reload and theme switching (which will eventually work better than it does right now).
The problem it solves is straightforward: when you’re drafting a visualization, you want a tight edit-save-see loop. The Jupyter kernel and VS Code extension are fine for notebook-oriented workflows, but sometimes you just want a file open in your editor and a window next to it that updates on save (which is what I did, basically immediately after getting the binary working). I despise VS Code and detest using a browser for “real work”, and this viewer pairs nicely with my Zed workflows.
ggsql-viewer is a single Go binary. It watches a .gsql file via fsnotify, shells out to ggsql exec/run on every write event, captures the resulting Vega-Lite JSON spec, and pushes it into an embedded webview. The webview runs vendored copies of Vega, Vega-Lite, Vega-Embed, vega-themes, and Alpine.js – all embedded into the binary via //go:embed, so there’s zero network access required at runtime.
The toolbar gives you a theme selector with all the vega-themes presets (ggplot2, quartz, dark, latimes, fivethirtyeight, and so on), an SVG/Canvas toggle for switching the Vega renderer, and export to PNG/SVG. The theme selector’s still WIP but functional.
Under the hood, an embedded HTTP server serves the viewer HTML and vendored JS on a random localhost port. The webview navigates to that local URL. When your editor saves the file – the watcher handles atomic saves from vim and VS Code correctly – Go re-runs ggsql exec and injects the new spec into the webview via Eval("updateSpec(...)"). The JS side calls vegaEmbed() with whatever theme and renderer you’ve selected.
Usage:
go build -o ggsql-viewer .ggsql-viewer [--debug] query.gsql
The --debug flag enables webview dev tools if you need to inspect the rendering. You’ll need Go 1.22+, ggsql on your PATH, and the usual platform webview dependencies: WebKit on macOS via Xcode CLI tools, libgtk-3-dev + libwebkit2gtk-4.1-dev on Linux, WebView2 runtime on Windows 10+.
Future plans include directory mode (watch a folder of .gsql files, pick from a dropdown), custom theme JSON loading from a local file, and a spec inspector for viewing the raw Vega-Lite output. Source is on Sourcehut. If you’re using ggsql at all, it’s worth having alongside – the tight loop it gives you makes the alpha-roughness of the toolchain much less painful to work around.
chartli
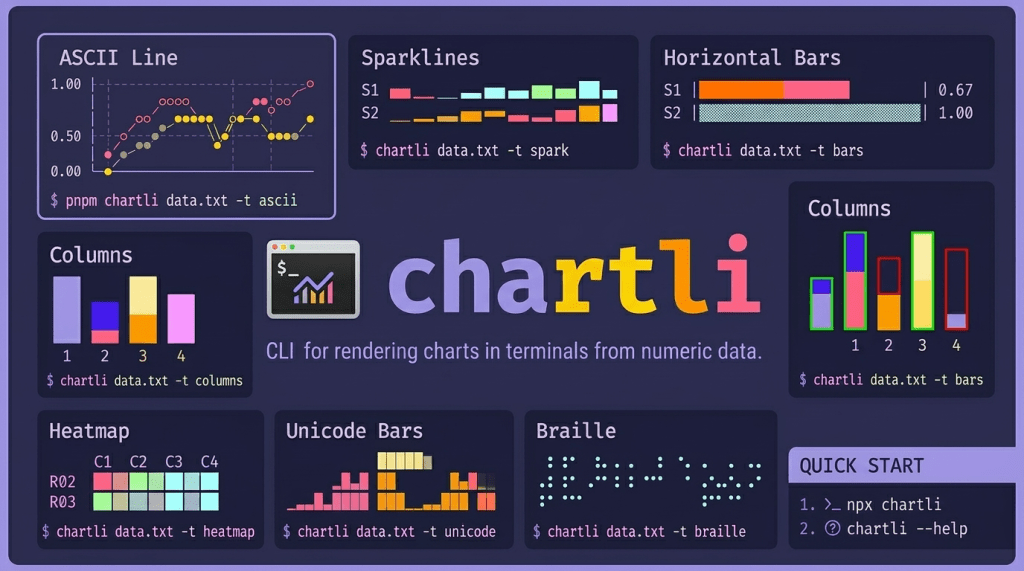
chartli is a small CLI from Ahmad Awais that renders charts directly in your terminal from numeric text data. It reads numbers from a file or stdin and draws them as ASCII line plots, sparklines, horizontal bars, vertical columns, heatmaps, unicode block charts, braille dot plots, or SVG. Eight output types from one tool, no browser required.
Install is the standard Node affair (npx chartli to run it once, pnpm add -g chartli if you want it around). The input format is plain text (i.e., one or more rows of space-separated numbers in a .txt file). Multi-series data gets separate rows, and chartli maps each to a distinct series in the output.
A few examples of what the output looks like in practice:
# sparklines from multi-series data$ chartli data.txt -t sparkS1 ▁▂▃▄▅▆S2 ▁▄▂▇▅█S3 ▁▂▄▃▆▅# horizontal bars with a fixed width$ chartli data.txt -t bars -w 28S1 |███████████████████ | 0.67S2 |▓▓▓▓▓▓▓▓▓▓▓▓▓▓▓▓▓▓▓▓▓▓▓▓▓▓▓▓| 1.00# ascii line chart$ chartli data.txt -t ascii -w 24 -h 8 1.00 │ ○ │ ◇ ◇ │ ◆ ● 0.50 │ ● ◆ │ ◇ ◆ ● │ ○ ◆ 0.00 │◇ ◆ ◇ ◇ └────────────────────────
The -t svg flag emits raw SVG to stdout (with -m lines or -m circles for the rendering mode), so you can pipe it to a file or into another tool. Width and height are controllable via -w and -h.
The codebase is TypeScript and Rust, built with tsup and tested with vitest. It ships a Command Code agent skill (npx skills add ahmadawais/chartli) if you’re in that ecosystem. Apache-2.0 licensed, currently at v0.0.5.
Where this fits: it’s a quick-glance tool. You have a column of numbers from a pipeline, a log, a quick DuckDB extract – pipe them through chartli and get a visual sanity check without leaving the terminal. The sparkline and braille modes are particularly useful for fitting a shape into a tight space (think tmux panes or CI logs). It’s not trying to be a full visualization system; it’s trying to be the wc -l of charting – the thing you reach for when you just want to see the data for a second before deciding what to do next.
FIN
Remember, you can follow and interact with the full text of The Daily Drop’s free posts on:
- 🐘 Mastodon via
@dailydrop.hrbrmstr.dev@dailydrop.hrbrmstr.dev - 🦋 Bluesky via
https://bsky.app/profile/dailydrop.hrbrmstr.dev.web.brid.gy
☮️

Leave a comment