Graffiti at the Network Layer; What CDNs Look Like When You Scan From the Edge; Amateur Instruments, Global Scale
All three resources in today’s Drop have something to do with observing something or some phenomenon. The last one was partially inspired by me coming across my very old GMC-300E (NOTE: that link goes to the “plus” version; mine is even more ancient).
Also, we’re using a new local model for the TL;DR. I wrote a bit about it here.
TL;DR
(This is an LLM/GPT-generated summary of today’s Drop. Ollama and ornith-35b.)
- Analysis of synchronized traffic from six Akkoma instances reveals how ActivityPub link previews can appear as network anomalies, with one instance using a routable IPv6 address to embed a political statement.
- A global CDN mapping exercise uses TLS certificate fingerprinting and BGP data to reveal the deployment footprint of major providers like Google GGC and Netflix OCA, though it struggles to detect CDNs like AWS CloudFront that present customer certificates at the edge (https://anuragbhatia.com/post/2026/06/cdn-mapping-across-the-globe/).
- The radmon.org network demonstrates how distributed amateur radiation sensors, including solar-powered ESP8266 kits, can collectively produce real-time global monitoring data that rivals professional instruments in covered regions (https://radmon.org).
Graffiti at the Network Layer

The Site Observatory agent that monitors one of my far too many web things flagged an anomaly during its daily run: seven IPs all showed up within sub-second windows on June 10th, then returned in tight synchronization on June 15th, 23rd, and 27th. Same posts, same order, milliseconds apart. The pattern looked like a distributed monitoring service or an uptime checker with a shared schedule.
It was neither. All seven were fediverse instances — six running Akkoma, one Friendica — that share overlapping follow graphs. When someone on one instance boosted a post, the link-preview fetcher fired on all of them within the federation propagation window. Synchronized timestamps are a byproduct of how ActivityPub works. No coordination required.
One of the six Akkoma instances runs at donotsta.re, hosted on 2a0d:eb00:8006::acab. The ::acab suffix is deliberate — “All Cops Are Bastards” encoded into a routable IPv6 address. The address belongs to AS204880, the autonomous system for Warsaw Hackerspace’s micro-ISP project, bgp.wtf. They describe themselves as “the non-profit ISP arm of the Warsaw Hackerspace, doing weird stuff on the Internet since 2017” — among other things, they sponsor ASNs and lease IPv6 space to “likely-minded entities around the world,” which is how a hackerspace member ends up with enough address space to put a political statement in their network suffix.
The instance operator, sdomi (Dominique Liberda), maintains a personal Akkoma instance with manual follow approvals, prefers AGE over PGP, and has published a Minecraft server written entirely in Bash. Their GitHub readme opens with a prompt injection attempt targeting LLM scrapers, then immediately apologizes to the human reader: “okay i think they’re gone.”
The actual observatory fix was mundane: add %Akkoma% to the fediverse classifier so future traffic from these instances stops inflating the human visitor count. But the anomaly that triggered the investigation was a small portrait of how the independent web still works: hackerspaces running their own ASes, leasing address space to members who use it to say things, personal instances with 64 posts and a single user, all federated together and occasionally reading a security blog in Maine.
What CDNs Look Like When You Scan From the Edge

Anurag Bhatia just published a global CDN mapping exercise that’s worth understanding both for what it reveals and for what the method misses. The approach is straightforward: pull every prefix from the global BGP routing table, slice them into /24s, scan port 443 on anything that’s live, grab the TLS certificate common name, and then join on MaxMind GeoIP Lite to get ASN and location context. The result is a snapshot of where Google GGC, Netflix OCA, Facebook FNA, Akamai, Microsoft, Apple, and AWS CloudFront have planted nodes across the world’s carrier networks.
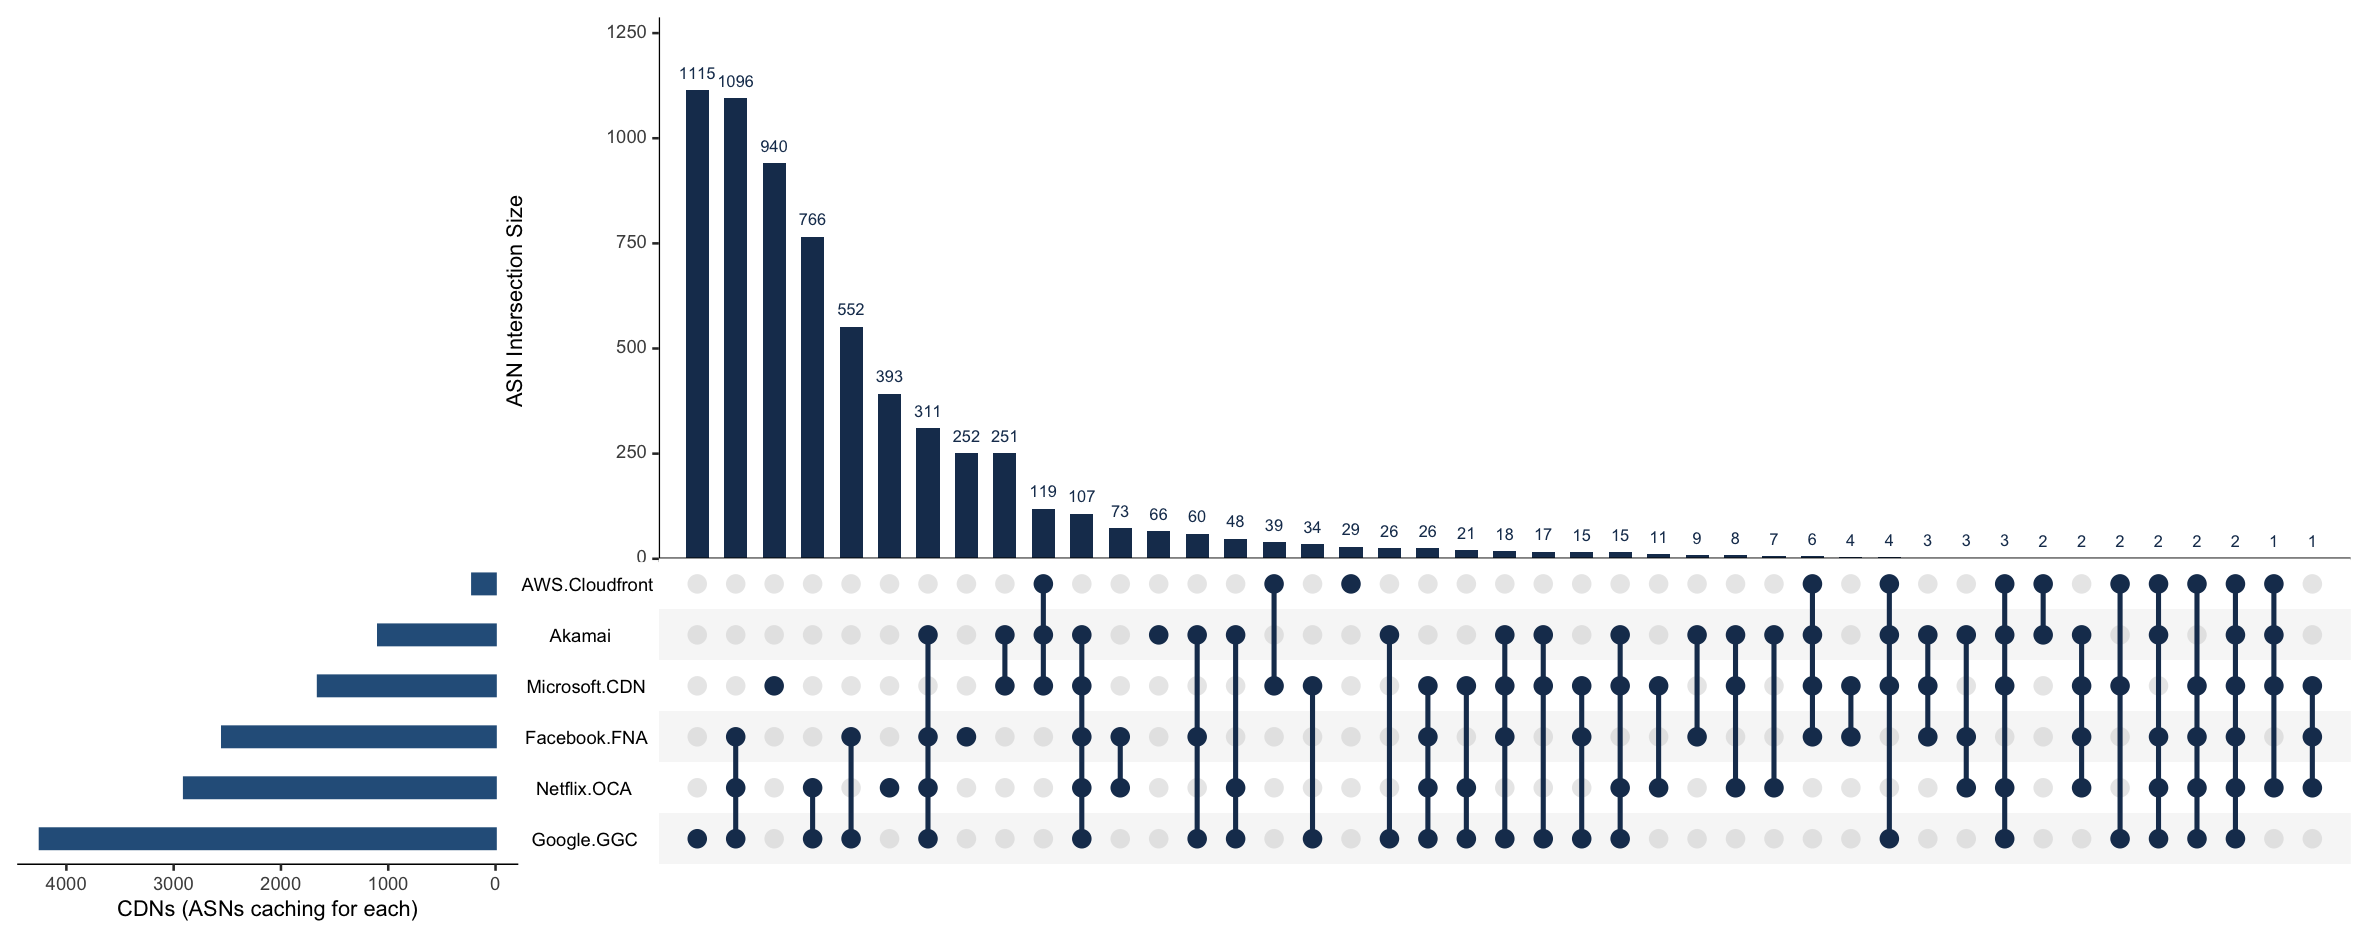
The numbers are striking at face value. Google GGC shows up in 4,247 unique ASNs spanning 215 countries. Netflix OCA appears in 2,903. Facebook FNA in 2,548. AWS CloudFront registers at just 217 — which looks almost comically small by comparison, and that gap is where the methodology’s main constraint becomes visible. The TLS common name trick works well for CDNs that consistently front their own edge nodes with their own certificates. Google reliably presents googlevideo.com. Netflix presents oca.nflxvideo.net. But CloudFront and Akamai are deeply in the business of presenting customer certificates on their edge nodes — your bank’s cert, your SaaS vendor’s cert, whoever is paying for the CDN service. Those nodes don’t say “amazonaws.com” on the door, so the scan walks right past them. The 217 vs 4,247 gap is almost certainly a measurement artifact rather than a deployment reality.
I grabbed Bhatia’s data and built an UpSet plot (section header) to make the co-presence structure readable. The tallest bars on the left — 1,115 and 1,096 ASNs respectively — represent networks that host only Google GGC or only Netflix OCA, not exactly surprising given how aggressively both companies have pushed appliance deployments into ISPs globally. The next significant cluster shows Facebook FNA and Google GGC co-located in 940 ASNs, which tracks with how both prioritize the same tier of regional carriers in developing markets. The plot makes clear how much of the long tail is unique co-presence combinations — hundreds of small-count intersections reflecting the patchwork of how CDN deals, peering agreements, and local market conditions produce wildly different deployment footprints across the world’s 70,000-plus ASNs.
Bhatia is candid in his accuracy notes: if a server doesn’t present the right certificate, or a CDN starts using a domain that’s not yet catalogued, the scan misses it. That’s not a criticism — it’s the honest shape of what TLS-certificate-based fingerprinting can and can’t see. The data tells you with confidence what’s there; it has nothing to say about what isn’t.
That distinction matters more for some CDNs than others. For Google, Netflix, and Facebook, this method is close to authoritative — their edge nodes present predictable, first-party certificates, so what the scan finds is roughly what’s deployed. For CloudFront and Akamai, the census is closer to inverted: the nodes that look like bare infrastructure are a small fraction of what’s actually serving traffic behind customer certificates. Any ranking that puts them next to Google by raw ASN count is measuring brand visibility at the edge, not edge footprint.
A complementary pass with active scan data from something like Censys — which crawls the full TLS certificate landscape across IPv4 space, including customer-issued certs sitting on CDN edge nodes — would give you a materially different picture of actual distribution. Until then, treat this as a reliable map of the CDNs that built their infrastructure to be seen, and a partial map of the ones that built it to be invisible. The BGP-table-first scoping decision is genuinely smart either way: scanning only routed space instead of the full IPv4 universe avoids an enormous amount of wasted effort and keeps the results grounded in infrastructure that’s actually in use.
Amateur Instruments, Global Scale

The observatory anomaly and the CDN mapping share a method: watch the network, trust that what you see has structure, then figure out what the structure actually means. The same pattern shows up in physical form at radmon.org — a global radiation monitoring map built almost entirely from amateur equipment.
Radmon is a free worldwide radiation monitoring network. It collects background radiation readings from a wide range of Geiger counters — home-built, kit-built, or commercial — submitted via Windows applications, Linux Bash scripts, Raspberry Pi Python, Arduino/ESP code, or custom implementations against their API. The live map shows stations everywhere from Europe to Japan to the Americas, each feeding real-time counts per minute into a shared database. The site supports alert thresholds and an “experimental mode” for when you’re intentionally testing something radioactive and don’t want to trigger a public alarm.
The hardware side is documented in the RadMon Plus kit, a solar-powered ESP8266-based Geiger counter designed for continuous outdoor monitoring. Unlike a typical clicky counter you wave at a suspicious rock, it’s a stationary IoT device: no speaker, readings every five seconds, WiFi backhaul to radmon.org and other services. The kit is likely the first to use the ESP8266 architecture for radiation monitoring. It was built to be left outside and forgotten.
Radmon.org works for the same reason the fediverse instances read as a network anomaly, and the same reason Bhatia’s scan is useful: a large number of independent, low-cost sensors, each with its own quirks, produces aggregate data that no single professional instrument could match. The radmon map has gaps — vast swaths of Africa and central Asia with no coverage, stations going dormant when their operator’s Pi overheats or their WiFi drops — but the density in covered areas is higher than most national monitoring networks. The DIYGeiger project notes that the PC-collected approach is “unique” in that the Geiger’s output is collected locally and then sent to the website, rather than the device connecting directly. It’s an idiosyncratic data path, but it works, and the aggregate result is a radiation map that updates in real time from actual human backyards.
The aggregate signal is real despite the blind spots: ActivityPub link previews aren’t human visitors, TLS fingerprinting misses customer certs, and an amateur DIY Geiger counter is not a calibrated instrument. But observation at scale doesn’t require centralized instrumentation — the fediverse instances produce synchronized observatory logs without knowing it, the CDN mapping turns a BGP table and port scanner into a global census, and the radiation network turns ESP8266 kits and Raspberry Pis into a distributed sensor grid. Together they produce something more useful than what you’d get from a single, more expensive observation point.
The independent web is still here. It just looks like network anomalies, certificate scans, and radiation counts until you step back.
I’ve got my logger code up on SourceHut, and it produces daily CSV files in this form:
mestamp_utc,cpm2026-06-28T20:41:25+00:00,202026-06-28T20:41:35+00:00,202026-06-28T20:41:45+00:00,192026-06-28T20:41:55+00:00,182026-06-28T20:42:05+00:00,192026-06-28T20:42:15+00:00,222026-06-28T20:42:25+00:00,252026-06-28T20:42:35+00:00,242026-06-28T20:42:45+00:00,252026-06-28T20:42:55+00:00,232026-06-28T20:43:05+00:00,212026-06-28T20:43:15+00:00,192026-06-28T20:43:25+00:00,162026-06-28T20:43:35+00:00,192026-06-28T20:43:45+00:00,182026-06-28T20:43:55+00:00,20
Once a few more days are captured I’ll get some visuals up on one of my sites and also get the data someplace folks can grab it from. It’ll take me a little longer to sync things to radmon.
FIN
Remember, you can follow and interact with the full text of The Daily Drop’s free posts on:
- 🐘 Mastodon via
@dailydrop.hrbrmstr.dev@dailydrop.hrbrmstr.dev - 🦋 Bluesky via
https://bsky.app/profile/dailydrop.hrbrmstr.dev.web.brid.gy
☮️
Leave a Reply