20 Million Particles; Can YOU DevTools?; Don’t Foget Our oklch Acquaintance
We’re keeping our focus up front, today, as we take a look at three resources dealing with various aspects of coding for and communicating with front end tech.
TL;DR
(This is an LLM/GPT-generated summary of today’s Drop using mlx_lm.generate + mlx-community/SmolLM3-3B-8bit and a custom prompt.)
I am experimenting with
mlx_lm, which is an inference framework specifically targeted towards Apple Silicon environments. I’ve been wanting to play with SmolLM3 since that July 8th blog post, but there has not been an Ollama-compatible model. So I used that framework’smlx_lm.generatewith the prompt from my OllamaModelfileand the result was a nigh instantaneous result (what you see below). This CLI tool shows some additional stats which are in a code block at below the bullets.
- 20 Million Particles: David Gerrells simulated 20 million particles at playable frame rates using JavaScript’s
TypedArraysandSharedArrayBuffersfor multi-threading, highlighting the importance of memory layout and cache behavior in JavaScript performance. (https://dgerrells.com/blog/how-fast-is-javascript-simulating-20-000-000-particles) - Can YOU DevTools?:
canidev.toolsprovides a cross-browser DevTools support matrix, including features like breakpoints, device emulation, and screenshots, with community-curated guides and configuration steps. (https://www.canidev.tools/?category=Network) - Don’t Forget Our
oklchAcquaintance: Jo Wood’s blog on modern colour spaces and Brett Cooper’sggchromaticpackage offer insights into the evolving role of colour spaces in visual storytelling and data visualization. (https://observablehq.com/@jwolondon/hello-modern-colour-spaces)
Here are the aforementioned stats:
Prompt: 1606 tokens, 649.117 tokens-per-sec
Generation: 214 tokens, 58.348 tokens-per-sec
Peak memory: 4.401 GB
20 Million Particles

In “How fast is javascript? Simulating 20,000,000 particles”, David Gerrells recently pushed JavaScript to its absolute limits, simulating 20 million particles at playable frame rates using nothing but CPU power. No GPU tricks, no WebAssembly — just plain JavaScript working harder than anyone thought possible.
David’s key stroke of insight turned out to be fairly brutal in its simplicity: stop treating JavaScript like JavaScript! Instead of representing particles as objects with properties, everything got flattened into TypedArrays where each particle becomes four tightly packed numbers. This isn’t just faster! It’s the difference between data scattered across memory and data that fits nicely in the CPU cache.
Multi-threading came via Web Workers sharing the same memory through SharedArrayBuffers. Each worker handles a chunk of particles, updating positions in parallel. The coordination was manual and careful, and David essentially built his own threading system on top of JavaScript’s event loop.
The real surprise was where things actually got slow. Physics calculations for millions of particles? No problem. Drawing those particles to the screen? That’s where everything falls apart. Random access to pixel buffers creates cache misses that kill performance, no matter how fast your CPU is.
The solution was immensely clever: instead of drawing individual particles, workers just increment counters in a shared grid showing how many particles occupy each pixel. The main thread later converts those counts to colors. By eliminating random memory access, rendering suddenly became manageable.
It turns out that hardware mattered more than one might expect. Apple Silicon, with its unusually large caches, consistently beat higher-core-count desktop processors. Raw compute power means nothing if you can’t keep data flowing to the cores.
The final results were super cool: 20 million particles at 20fps on a MacBook Air, with desktop systems pushing 30-40 million. This on a platform everyone regularly assumes is too slow for serious computation.
The broader lesson is that JavaScript performance isn’t fundamentally limited by the language. The limitations are introduced by how we typically use it. When you’re willing to think like a systems programmer and work directly with memory layout and cache behavior, JavaScript becomes capable of CPU workloads that seem impossible. All this time, the web development community has, perhaps, accepted certain performance ceilings that might not actually exist.
Can YOU DevTools?
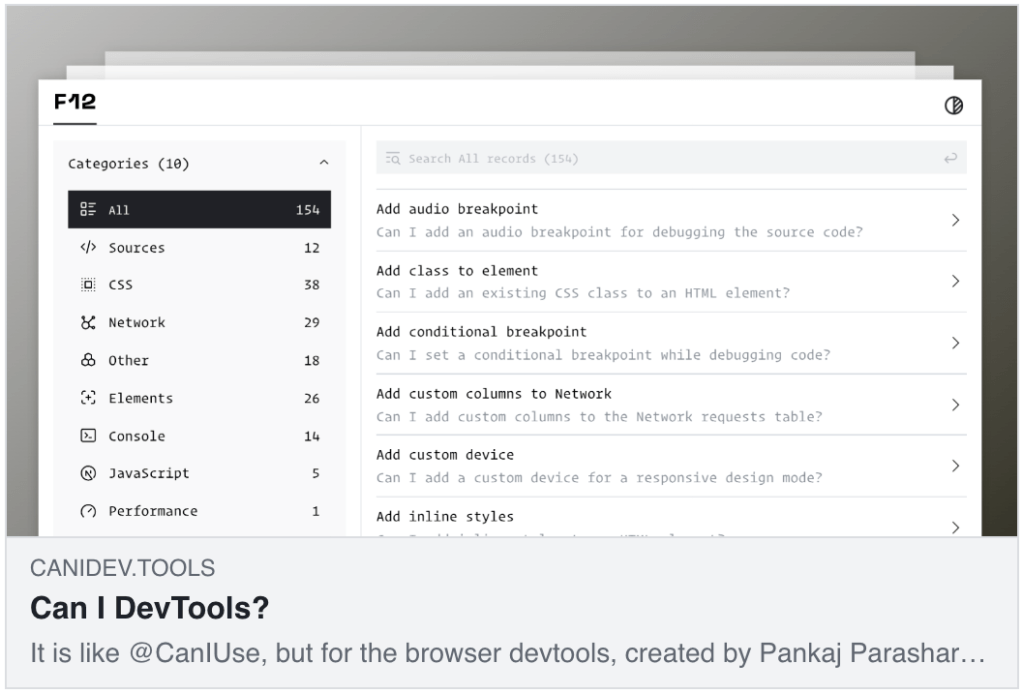
canidev.tools is a resource that helps us understand what features are available in browser developer tools across Chrome, Firefox, Edge, and Safari. Think of it as “Can I Use” but specifically for DevTools features rather than web platform compatibility. The platform is community-curated and was created by Pankaj Parashar.
The site provides a DevTools support matrix showing which features work in different browsers, along with how-to guides that give step-by-step instructions for using debugging features like breakpoints, device emulation, and screenshots. The community contributes improvements and updates to keep everything current, and each feature typically includes configuration steps, command palette tips, and keyboard shortcuts.
Some key areas covered include breakpoints where you can learn to add conditional, logpoint, and audio stops by right-clicking line numbers. Device emulation guidance shows how to add custom devices and simulate different viewports through Settings > Devices. For requests and overrides, you’ll find instructions for blocking network patterns or overriding responses using the Network panel tools. Screenshots coverage explains capturing full page, node, or high-definition screenshots via the command menu using Cmd+Shift+P. Style autocomplete help covers using DevTools to autocomplete style declarations and values when entering values in the Styles pane.
This cross-browser documentation lets you maintain consistent debugging workflows across different browsers, while the streamlined design makes it easy to find specific answers or discover efficient ways to perform common DevTools tasks.
I sometimes get lost when I’m poking at Safari’s DevTools (I spend most of my time in Chromium-based environments), and this resource has been helpful when I need to do the same ops in a foreign DevTools environment.
Don’t Foget Our oklch Acquaintance
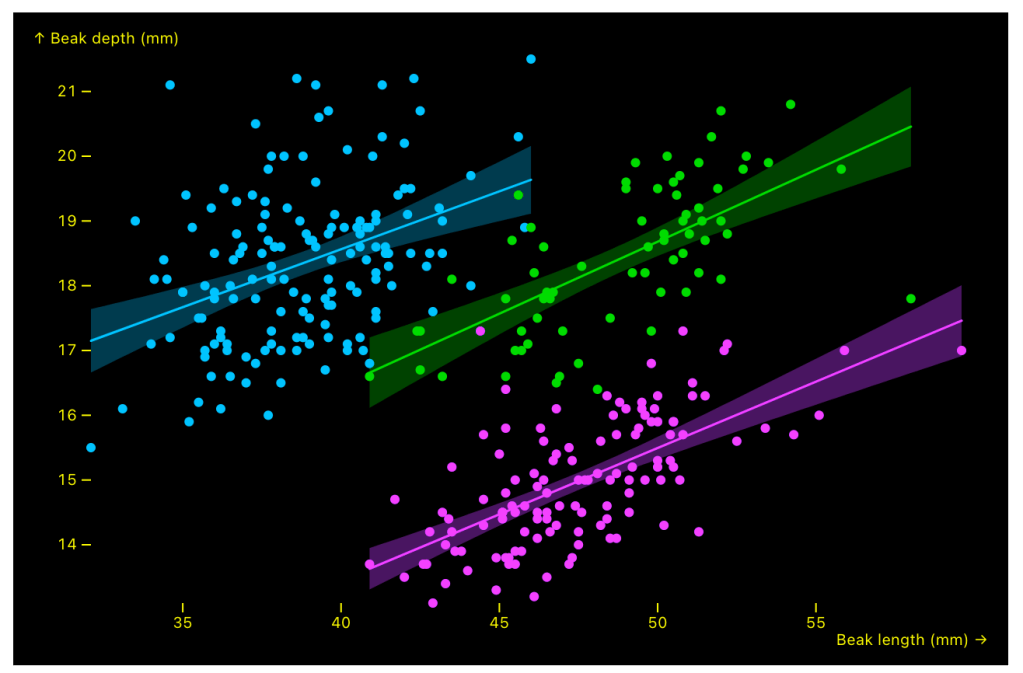
We’ve covered oklch color spaces in a few Drops, but this resource was so gosh darn good (and expands upon previous resource Drops) that I had to find a Drop to add it to.
Colour spaces underpin the look and impact of every artefact we create. The shift from sRGB to P3 is a sign of a burgeoning trend: visual storytelling has more expressive tools than ever before. Yet with this power comes some realcomplexity, which requires ongoing attention to device support, audience diversity, and the science of colour perception.
Jo Wood’s focus on the new generation of colour spaces is a must-bookmark and must-read resource for anyone working with data and design to stay up to date with what modern displays can — and should — do. I will leave you (shortly) in Jo’s capable hands (and Observable Notebook).
R folks can take advantage of these via Teun van den Brand’s excellent [{ggchromatic}](teunbrand/ggchromatic: Colour and fill scales for ‘ggplot2’ using colour spaces.) package.
An honorable mention goes to Brett Cooper’s mini P3/oklch color explorer.
FIN
Remember, you can follow and interact with the full text of The Daily Drop’s free posts on:
- 🐘 Mastodon via
@dailydrop.hrbrmstr.dev@dailydrop.hrbrmstr.dev - 🦋 Bluesky via
https://bsky.app/profile/dailydrop.hrbrmstr.dev.web.brid.gy
☮️

Leave a comment