MySpeed; DuckDB vs. Coreutils; wrk
The weekend Bonus Drop explores three tools that each tackle different aspects of performance.
Aside: My JetKVM arrived about a week ago, and it’s as good as I hoped it would be. Highly recommend it if you need to remote to a system. It’s also super hackable.
TL;DR
(This is an AI-generated summary of today’s Drop using Ollama + llama 3.2 and a custom prompt.)
- MySpeed is a self-hosted internet connection monitoring tool that tracks speeds and latency for 30 days with support for multiple test providers and health alerts (https://myspeed.dev)
- DuckDB showed mixed performance against traditional Unix tools like
wc -lin CSV processing tasks, with optimized parallelcoreutilsultimately performing faster (https://szarnyasg.org/posts/duckdb-vs-coreutils) - wrk is a high-performance HTTP benchmarking tool featuring Lua scripting for request customization and detailed performance metrics (https://github.com/wg/wrk)
MySpeed
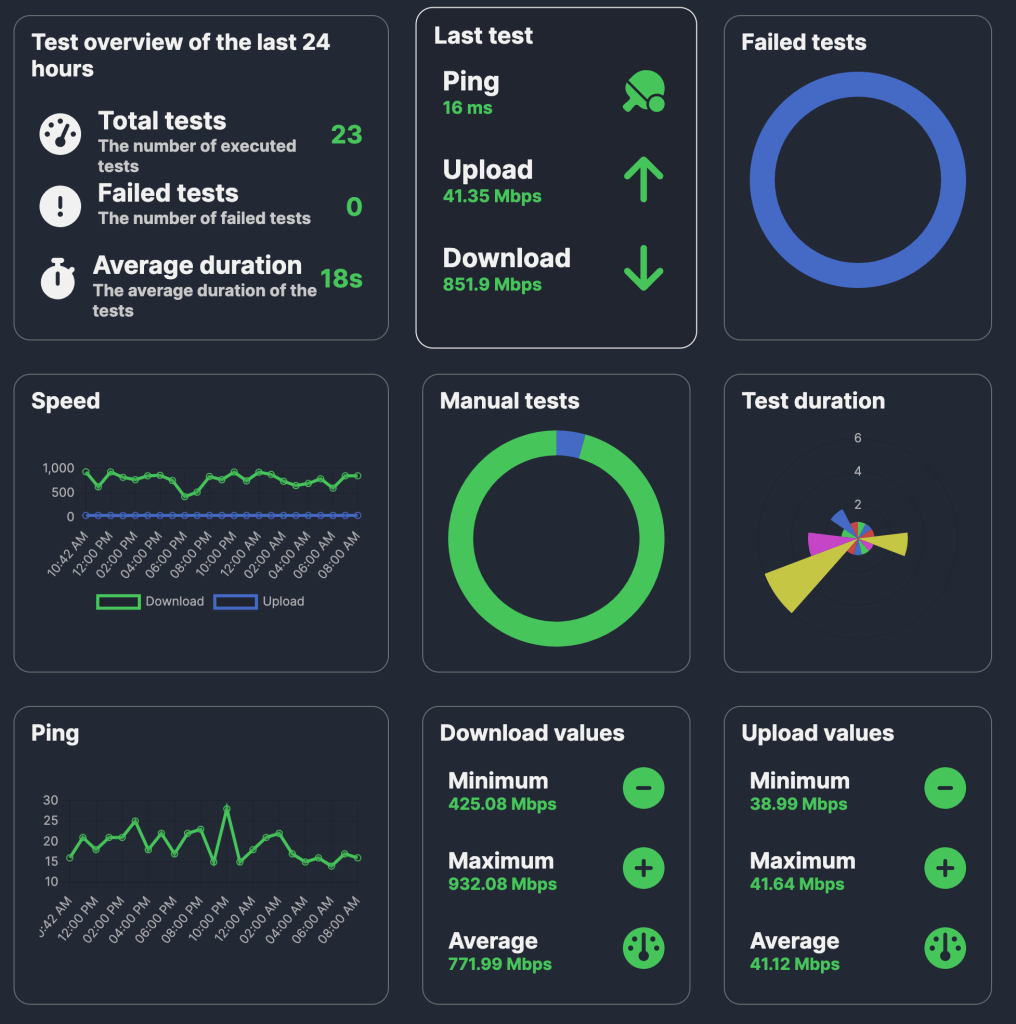
MySpeed (GH) is a self-hosted internet connection monitoring tool that tracks download/upload speeds and latency, storing 30 days of performance data. It automates speed tests via Cron scheduling and supports multiple test providers including Ookla, LibreSpeed, and Cloudflare.
The tool can send connection health alerts through email, Signal, WhatsApp, or Telegram. Performance data can be visualized through Prometheus and Grafana integration.
It works on Windows (ugh), macOS, and Linux, and has a well-crafted Docker image.
I use it to keep both Comcast (my ISP) and Ubiquiti (my router, which has a built-in speed tester) honest, and rememberd I needed to get it on the new home server. The section header shows the last day’s tests.
DuckDB vs. Coreutils

Back in December, Gabor Szarnyas conducted a series of experiments comparing DuckDB with traditional UNIX command-line tools, specifically focusing on tasks like counting lines in CSV files. 
The initial, basic test was to have DuckDB go head-to-head with wc -l (which is commonly used to count lines in a file). On a macOS system, DuckDB outperformed wc -l, completing the task in 1.2 seconds compared to wc -l‘s 2.9 seconds. This result sparked discussions, with critics pointing out that DuckDB’s advantage might be due to its use of multi-threading and that wc -l performs better on Linux systems.
To address these points, Szarnyas conducted further tests on a very robust Linux server equipped with 64 AWS Graviton 3 vCPU cores and high-speed NVMe SSDs. Using a 300 MB CSV file containing a year’s worth of railway data, he found that wc -l completed the line-counting task in 0.6 seconds, while DuckDB took 0.9 seconds, indicating that wc -l was faster in this environment.
Expanding the dataset to 15 GB of CSV files covering five years of railway services (approximately 108 million lines), DuckDB leveraged its multi-threading capabilities to process the data in 2.2 seconds, outperforming the single-threaded wc -l, which took 3.2 seconds. However, when Szarnyas introduced uutils coreutils (a Rust-based reimplementation of GNU coreutils which we’ve covered before), the wc command’s performance improved to 1.8 seconds, surpassing DuckDB. Further optimization using GNU Parallel to enable multi-threaded processing allowed wc -l to process the data in just 0.5 seconds, making it the fastest among the tested methods.
Szarnyas also explored more complex tasks, such as counting specific entries (e.g., “Intercity” services) within the dataset. For this, he compared traditional UNIX tools like grep and wc with DuckDB’s SQL queries. The results showed that while DuckDB performed well, optimized UNIX tools with parallel processing were slightly faster.
There are many more details and benchmarks in the post, and it was fun and informative seeing how Gabor approached this new set of tests.
wrk

wrk is a high-performance HTTP benchmarking tool that can be scripted with Lua for request customization and execution. It uses a thread-based architecture to generate load, with each thread managing multiple connections. This enables efficient simulation of concurrent users without excessive resource consumption.
The Lua scripting interface is pretty straightforward. You include and modify hooks into the request lifecycle:
-- Setup phase
function setup(thread)
  -- Initialize thread-local variables
end

-- Request customization
function request()
  -- Return request object
  return wrk.format("GET", "/api/v1/data")
end

-- Response handling
function response(status, headers, body)
  -- Process server response
end
For instance, you could hook request() to change-up what paths are hit when a thread is scheduled to handle the task:
-- Generate randomized requests
function request()
  local paths = {"/api/v1/users", "/api/v1/data", "/api/v1/auth"}
  local path = paths[math.random(#paths)]
  return wrk.format("GET", path)
end
It’s a benchmarking tool, so you get lots of metrics back, including the number of requests/second, distribution of latency measures, socket connection states, error rates, and more.
Let’s give it a go with SWS:
$ docker run --rm -it -d -p 9911:80 joseluisq/static-web-server
$ wrk -t12 -c400 -d30s http://localhost:9911
Running 30s test @ http://localhost:9911
  12 threads and 400 connections
  Thread Stats   Avg      Stdev     Max   +/- Stdev
    Latency   103.05ms  203.96ms   1.62s    89.85%
    Req/Sec     4.96k     2.43k   17.91k    69.70%
  1770512 requests in 30.01s, 1.26GB read
  Socket errors: connect 0, read 475, write 0, timeout 74
Requests/sec:  58987.62
Transfer/sec:     43.15MB
There are plenty of example scripts to riff from if you do need more advanced testing capabilities.
FIN
Remember, you can follow and interact with the full text of The Daily Drop’s free posts on:
- 🐘 Mastodon via
@dailydrop.hrbrmstr.dev@dailydrop.hrbrmstr.dev - 🦋 Bluesky via
https://bsky.app/profile/dailydrop.hrbrmstr.dev.web.brid.gy
Also, refer to:
to see how to access a regularly updated database of all the Drops with extracted links, and full-text search capability. ☮️

Leave a comment